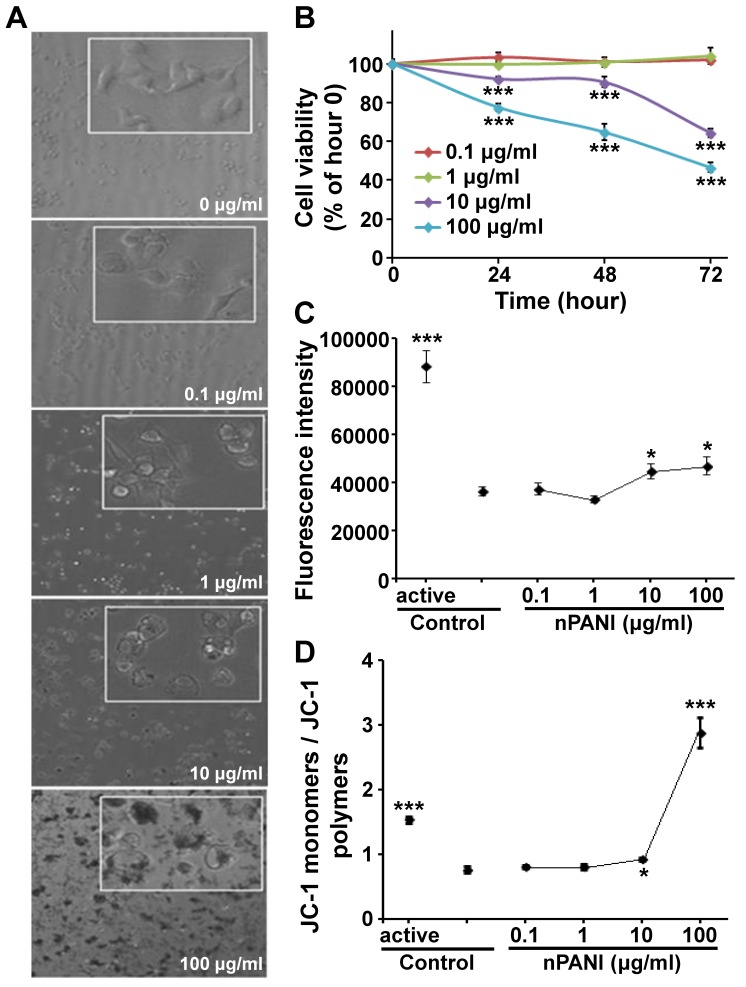
Figure 2. Cytotoxicity of nPANI.
(A) Morphology of macrophages under phase-contrast microscope (20× objective, inset: 40×) treated with nPANI at different concentrations. (B) Cell viability of macrophages treated with nPANI at different concentrations for different time periods. (C) ROS production by macrophages after being incubated with nPANI at different concentrations for 6 hours. (D) Effect of 6 hours incubation of nPANI on the mitochondrial membrane potential of macrophages. All data were expressed by mean ± S.E.M. of six measurements and each experiment was performed in triplicate. * and *** denote p<0.05 and 0.001 versus the corresponding control.

