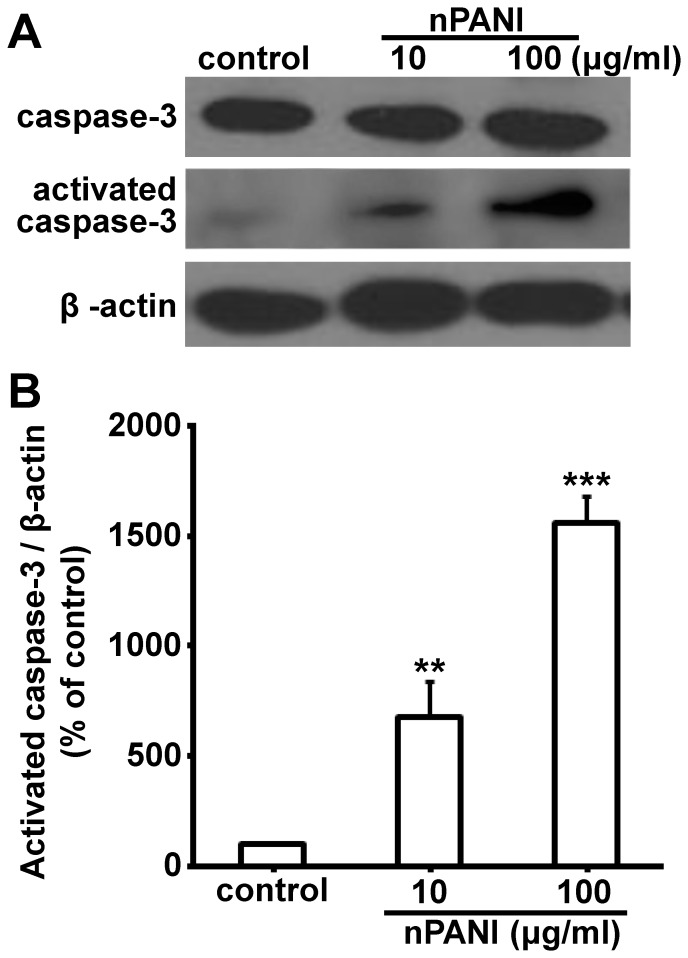
Figure 3. The effects of nPANI on the expressions of caspase-3 and activated caspase-3 expressions in macrophages.
(A) Representative Western blots of the caspase-3 and β-actin expressions. (B) The relative levels were analyzed by determining the ratio of the activated caspase-3/β-actin. The values are the means ±S.E.M. of three replicates. ** and *** denote p<0.01 and 0.001 versus the control, respectively.

