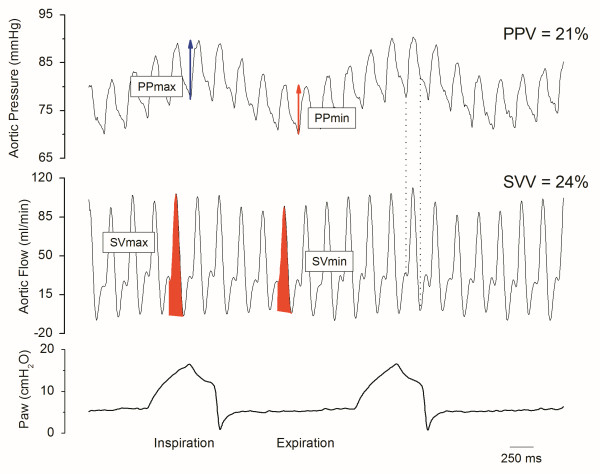
Figure 1.

Raw data showing aortic pressure and flow in one rabbit after blood withdrawal. PP: pulse pressure, SV: stroke volume, Paw: airway pressure, SVV: stroke volume variation, PPV: pulse pressure variation. Shaded areas represent the SV during expiration (SVmin) and inspiration (SVmax), respectively. Dotted lines state the systolic portion of the aortic flow curve.
