
Figure 3.
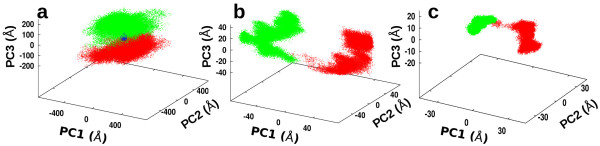
Principal component analysis of the LSD1/CoREST atom fluctuations depending on the region of the LSD1/CoREST. The unbound (red) and H3-bound (green) conformational ensembles were analyzed for (a) all Cα-atoms in LSD1/CoREST, (b) the Cα-atoms in the AO domain only, and (c) all atoms of the H3-binding site residues (c). Data points in regions that overlap are highlighted in blue. See also Figure 2 for a structural identification of the three regions considered.