
Figure 5.
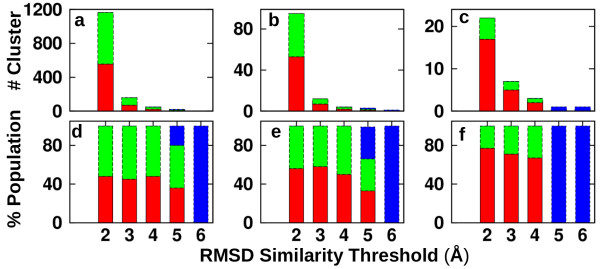
Analysis of conformational selection based on a combined conformational clustering approach. Number of clusters obtained as a function of RMSD similarity threshold used for clustering analysis for different selection schemes (a: ‘whole’; b: ‘AO domain’; c: ‘H3-binding site’) and corresponding relative populations (d: ‘whole’; e: ‘AO domain’; f: ‘H3-binding site’). Red: clusters with members only from the unbound MD ensemble. Green: clusters with members only from the H3-bound MD ensemble. Blue: clusters with members from both unbound and H3-bound MD ensembles. Conformational clustering was performed using the selection schemes in Figure 2.