FIGURE 3.

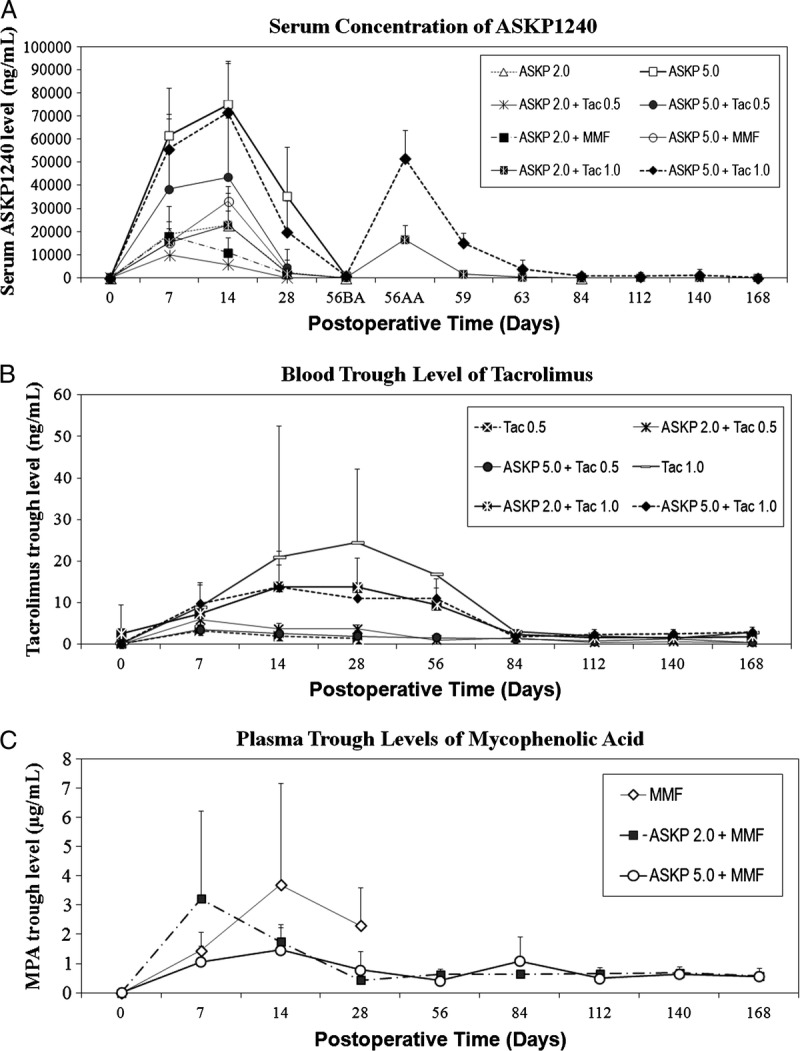
Pharmacokinetic evaluation. A, The mean (±SD) serum trough levels of ASKP1240 in groups 3 to 6, 8, and 9, as well as mean (±SD) serum concentration transitions of ASKP1240 in groups 11 and 12. Serum concentrations of ASKP1240 increased in a dose-dependent manner and decreased to relative lower levels 2 weeks after drug administration in maintenance phases. (56BA=before ASKP1240 administration on day 56, 56AA=1 hr after ASKP1240 administration on day 56, day 59=3 days after ASKP1240 administration, day 63=7 days after ASKP1240 administration). B, The mean (±SD) whole blood tacrolimus trough levels increased in a dose-related manner. C, Mean (±SD) plasma trough levels of mycophenolic acid. In general, in the induction phrase, plasma trough levels of mycophenolic acid revealed relatively higher level that was associated with the frequency of MMF administration. The plasma trough levels of mycophenolic acid were stable in maintenance phases. Tac 0.5, tacrolimus 0.5 mg/kg; Tac 1.0, tacrolimus 1.0 mg/kg; ASKP 2.0, ASKP1240 2.0 mg/kg; ASKP 5.0, ASKP1240 5.0 mg/kg; MMF, mycophenolate mofetil 15 mg/kg; SD, standard deviation. 118×157 mm (600×600 DPI).
