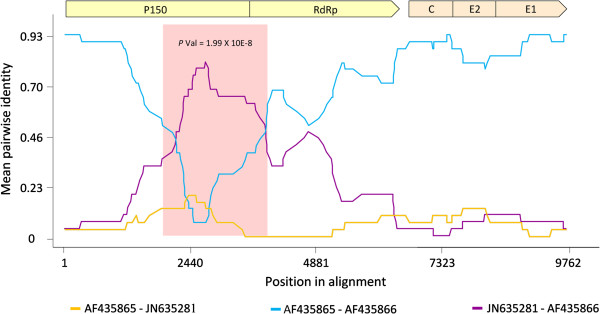
Figure 2.

Pairwise identity plot of the potential recombination event detected in the full genome RV dataset. The non-structural and structural coding regions are shown above the plot, in blue and green respectively (plot scale drawn with respect to isolate [GenBank:AF435866]). The y-axis represents the mean pairwise identity between the sequences within a 30-nucleotide window moved one nucleotide at a time along the length of the genome. Pairwise comparisons between the major [GenBank:AF435865; isolate contributing a larger segment of nucleotide sequence] and minor [GenBank:JN635281; isolate contributing a smaller segment of nucleotide sequence] parents are shown in orange, between the major parent and recombinant [GenBank:AF435866] in cyan, and between the minor parent and recombinant sequences, in purple. The area outlined in pink demarcates the potential recombinant region (P value < 0.05).
