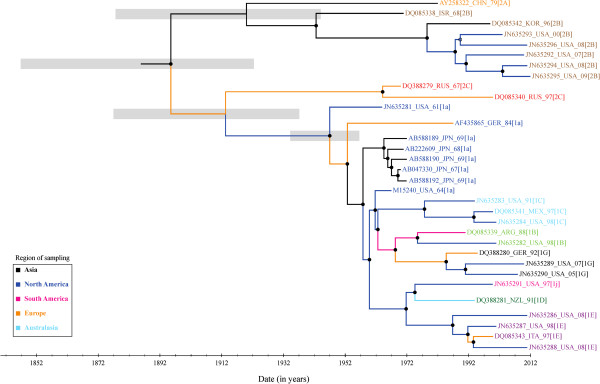
Figure 4.

Maximum clade credibility tree of the full genome recombination-free dataset. Maximum clade credibility tree constructed from the 32 full recombination-free RV genomes under the TN93 + G + I nucleotide substitution model and the Bayesian skyline plot, relaxed-clock evolutionary model. Branches are coloured according to the region of sampling and the taxon labels according to the genotype. Internal nodes with posterior support greater than 90% are indicated by a filled circle and greater than 80% by an open circle. Thick grey lines at the root and most basal nodes of clade 1 and 2 genotypes, respectively, represent the 95% HPD of the time to the most recent common ancestor.
