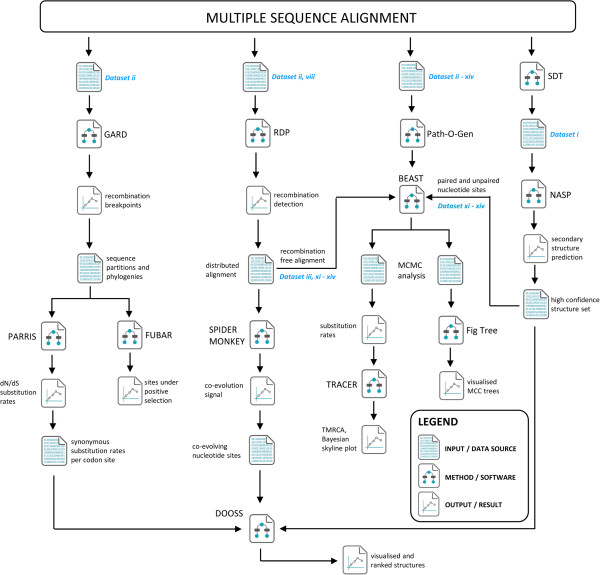
Figure 5.

Graphical representation of the analysis pipeline. Sequence alignments were prepared using the MEGA package. The NASP method provides coordinates of potentially paired sites across the genome, using the representative sample of 10 full genome sequences as its input (dataset i, see Methods section). The GARD and RDP methods search for possible recombination breakpoints across the full alignment space and produce recombinant free partitions along with their corresponding phylogenies, which served as input for the PARRIS, FUBAR, and SPIDERMONKEY methods. Both PARRIS and FUBAR were used to determine substitution rates across the coding regions, whereas SPIDERMONKEY was used to detect sites which may be coevolving while still mainting complementary base-pairings. The DOOSS program was used to annotate and rank the NASP predicted nucleic acid secondary structures using the data sources obtained from the selection analysis above (FUBAR and SPIDERMONKEY). BEAST analysis was carried out using datasets in which the potential recombinants detected by RDP were removed, in addition to removing nucleotide sites which were predicted by NASP to form part of the high confidence structure set (HCSS). TRACER was used to analyse the resulting trace files, whereas the BEAST generated MCC tree files were summarised and annotated using FigTree.
