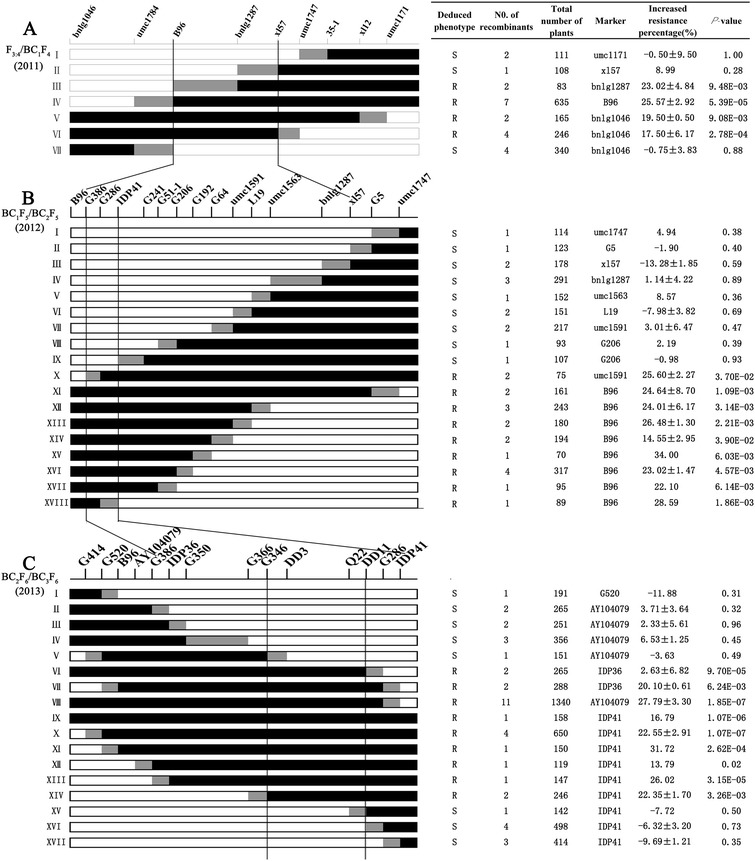
Figure 2.

Sequential fine-mapping of the major QTL qRgls2 in recombinant maize cultivated from 2011 to 2013. The 22 F4 (A), 32 BC1F5 (B), and 42 BC2F6 (C) recombinants were classified into 7, 18, and 17 types, respectively. The genomic architecture for each type is depicted as black, white, and gray rectangles, representing heterozygous Q11/Y32, homozygous Q11/Q11, and mixed regions (in mixed regions recombination occurs, but the exact breakpoint is uncertain), respectively. Table on the right: Increased resistance percentage is defined as the difference in resistance percentage between genotypes Q11/Y32 and Q11/Q11 that resulted from the donor region of Y32; The total number of plants refers to all progeny of a given recombinant type; List of markers used to detect the presence/absence of the donor region; A P-value of ≤0.05 indicates the regression coefficient between genotype and disease scale is significant within the progeny derived from a given recombinant type. This suggests the presence of qRgls2 on the donor region, and the parental recombinant was deduced to be GLS resistant (R). A P-value of >0.05 indicates that no significant correlation between genotype and disease scale is present, suggesting that qRgls2 is absent from the donor region of the parental recombinant, which is therefore marked as GLS susceptible (S). Analysis of both the deduced phenotype and the donor region for all recombinants enabled us to narrow qRgls2 from an ~110-Mb to an ~1-Mb region, flanked by the markers G346 and DD11.
