Figure 3.

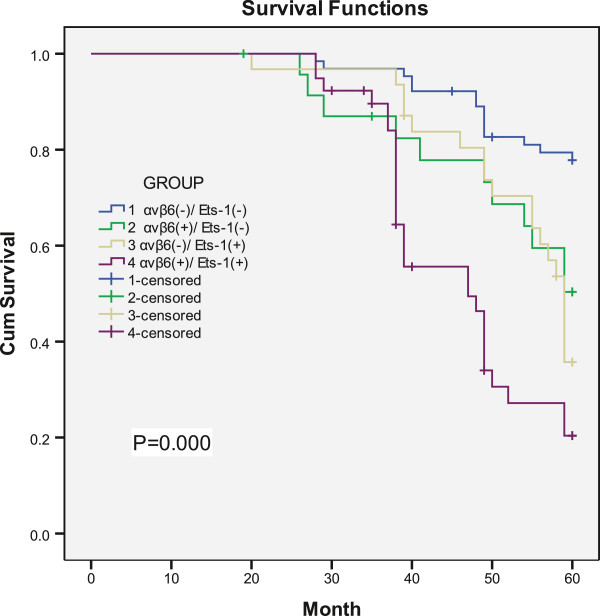
Patients survival time is shown by Kaplane-Meier survival analysis using a Log-rank test. The samples were grouped according to αvβ6 and Ets-1 expression. (P = 0.000).

Patients survival time is shown by Kaplane-Meier survival analysis using a Log-rank test. The samples were grouped according to αvβ6 and Ets-1 expression. (P = 0.000).