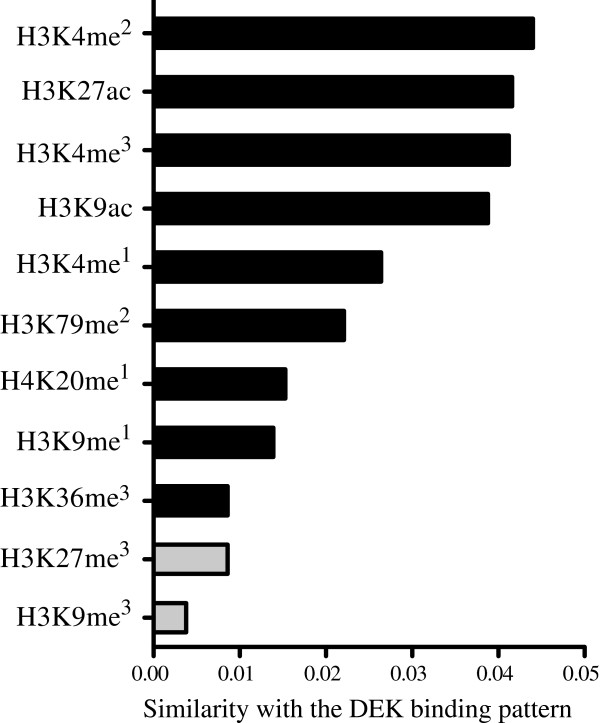
Figure 4.

DEK binding correlates with activating histone marks. Similarity between the DEK binding pattern and those of ChIP-seq experiments from the Broad Histone K562 dataset in Encode, showing the highest similarity with activating histone marks (black bars) and the lowest similarity with the two repressive histone marks (grey bars).
