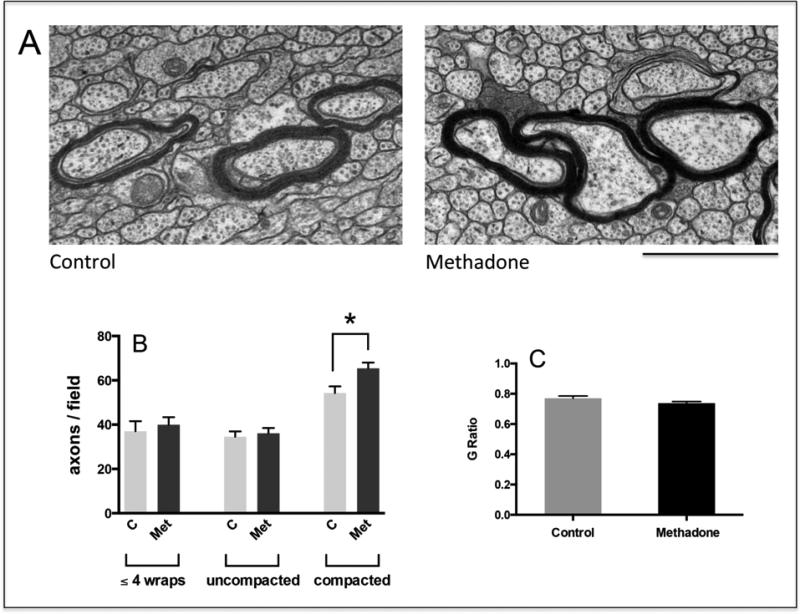
Figure 4. Perinatal exposure to methadone alters the distribution of axons at different stages of myelination.
(a) Corpus callosum sections from 16-day-old pups were analyzed by EM and classified within 3 different categories as indicated in the legend to figure 3, i.e. axons at the initial stage of myelination, axons at intermediate stages of myelin formation (C = Control; Met = methadone), and axons with already compacted myelin sheaths. Scale bar = 1 μm. Notice that axons within the 3 categories coexist in the samples from both methadone-exposed and controls pups. (b) The bar graph indicates the number of axons/field from each category, shown as the mean ± SEM from at least 12 fields/pup and a total of 5,000 axons/experimental group; (C = Control; Met = methadone); * p < 0.05. (c) G ratios for axons within the c category (compacted myelin) were calculated from the corresponding myelinated axons and fiber diameters (G ratio: diameter of axon alone/diameter of axon +myelin)

