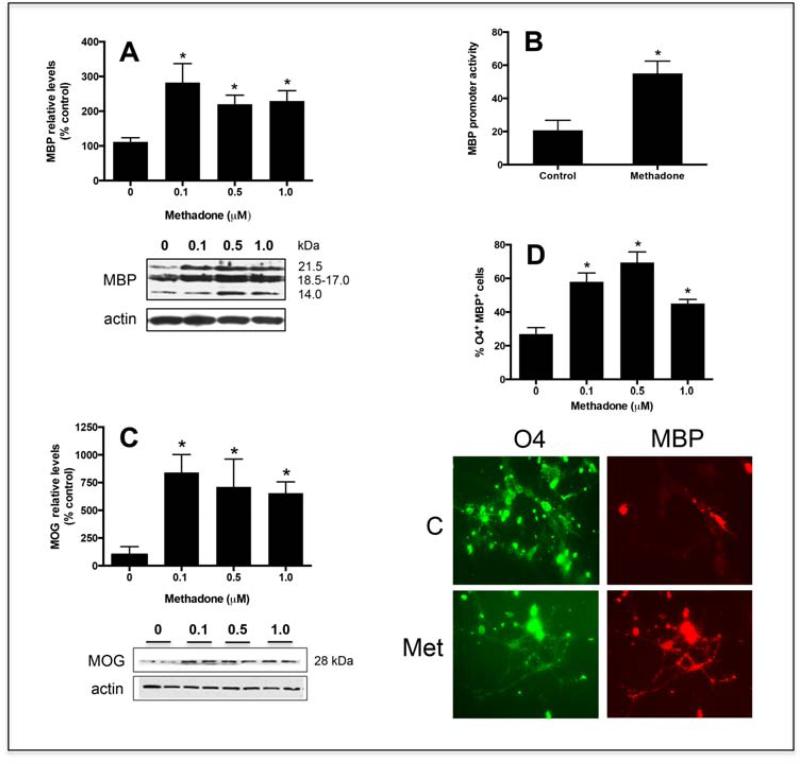
Figure 6. Methadone stimulates the differentiation of pre-oligodendrocytes.
(A) Pre-oligodendrocytes isolated from 9-day-old rat brains were incubated for 3 days in CDM with or without 0.1, 0.5, or 1.0 μM methadone. MBP levels were determined by Western blotting using β-actin levels as loading controls. The figure corresponds to a representative experiment. Results in the bar graph are expressed as percentage of controls (0 μM methadone) ± SEM from at least 5 experiments and correspond to the combined scanning of the four major MBP isoforms. 0 vs. 0.1 μM, p<0.02; 0 vs. 0.5 μM, p<0.002; 0 vs. 1.0 μM, p<0.005; 0.1 vs. 0.5 vs 1.0 μM, NS. (B) Pre-oligodendrocytes were co-transfected with a firefly luciferase construct under control of the MBP gene promoter and a renilla luciferase vector used as sample size and transfection control. After 24 hrs in the presence of 0.5μM methadone, the cells were assayed for firefly and renilla luciferase activities. Relative MBP promoter activities were calculated as ratios of firefly to control renilla luciferase luminescence readings. The values represent the mean ± SEM from 3 separate experiments, * p<0.03. (C) Pre-oligodendrocytes were incubated for 3 days in CDM with or without 0.1, 0.5, or 1.0 μM methadone as indicated in (A) and MOG levels determined by Western blotting using β-actin levels as loading controls; 0 vs. 0.1, 0.5, and 1.0 μM, p < 0.05. (D) Pre-oligodendrocytes were cultured for 3 days in CDM alone (control) or supplemented with 0.1, 0.5, or 1.0 μM methadone. Cells were analyzed by double immunocytochemistry with O4 (green) and anti-MBP (red) antibodies. Scale bar: 10μm. The bar graph indicates the percentage of O4 positive cells that are also MBP positive under each experimental condition. The results represent the average ± SEM from 3 different experiments; 0 vs. 0.1, 0.5, and 1.0 μM, p < 0.0; 0.1 vs. 0.5 vs 1.0 μM, NS.

