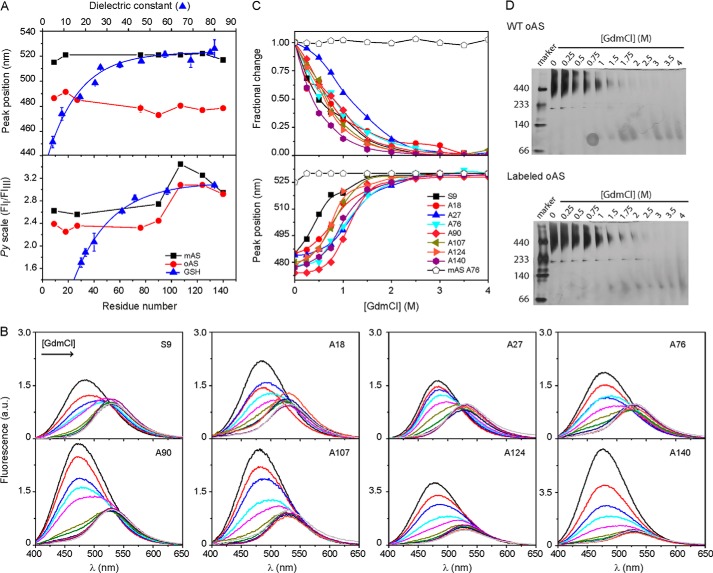
FIGURE 3.
Mapping environmental properties. A, spectral signatures of acrylodan- and pyrene-labeled AS monomers (■) and oligomers (●). The peak wavelength of acrylodan emission (upper panel) and the Py scale of pyrene (lower panel) defined as the ratio of the intensities of the first (375 nm) and third (385 nm) emission bands, are plotted as a function of the labeled position. Initial label density for oAS preparation was 5% in both cases. The spectral variation of the dyes conjugated to GSH in solvents of increasing dielectric constants (▴) are shown for comparison. The polarity reference curves were obtained from the spectra of labeled GSH redissolved in the following: Cl3CH, Cl3CH:ethanol (12.5%), n-butanol, ethanol, mixtures of H2O:dioxane (50, 45, 35, 25, 15, and 5%) and H2O for acrylodan, and the protic solvents n-butanol, n-propanol, ethanol, ethylene glycol, glycerine, formic acid, and H2O for pyrene. Dye concentration was ∼ 1 μm. B, acrylodan fluorescence spectra of oAS labeled at different positions along the protein sequence at increasing GdmCl concentrations. C, site-specific GdmCl denaturation profiles of acrylodan-labeled oAS. Fractional changes in fluorescence intensity at 480 nm (upper panel) and peak wavelength (lower panel) of acrylodan emission are plotted as a function of GdmCl concentrations. The spectral changes of the monomer labeled at position Ala76 as a function of denaturant concentration is also shown for comparison (open symbols). D, native gradient (4–15%) PAGE of wild-type (upper panel) and acrylodan-labeled (lower panel) oAS at increasing GdmCl concentrations. The gels were overstained to reveal the presence, if any, of low-populated partially dissociated intermediates.

