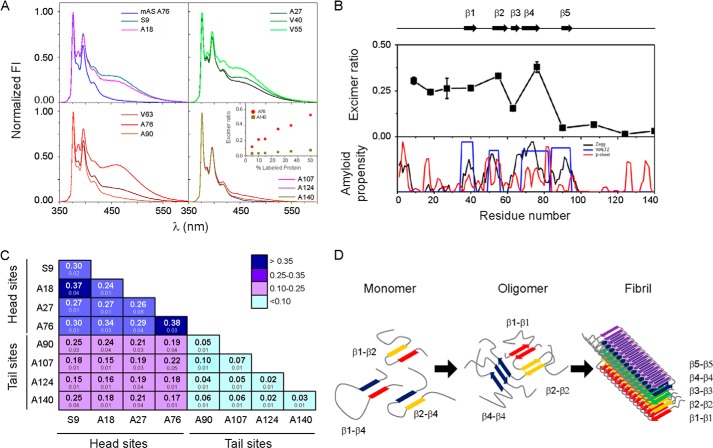
FIGURE 4.
Identifying intermolecular contacts in oAS. A, fluorescence emission spectra of oAS labeled with pyrene at different positions along the protein sequence. The monomer labeled at position Ala76 is shown for comparison. The spectra were normalized to the intensity of the monomeric peak (375 nm). The inset shows the excimer ratio of oAS labeled at position Ala76 (●) and Ala140 (■) at increasing initial label density. B, proximity analysis assessed by excimer fluorescence in oAS labeled with pyrene at single sites (upper panel) along with AS aggregation propensity predicted by Zyaggregator (black line) and WALTZ (blue line), and β-sheet propensity (red line) computed by TANGO (lower panel). β-Strands defined within the cross-β-fibrillar amyloid core are represented as black arrows and numbered β1 to β5. C, excimer fluorescence of oAS assembled from 1:1 mixtures of two pyrene-labeled AS variants. Mean values of independent duplicates ± S.D. are indicated. Head and tail sites are marked with lines. D, schematic representation of structural reorganization of segments participating in the cross-β-amyloid core during AS fibril formation. Transient tertiary contacts in the monomeric protein (9) can foster aggregation. Rearrengements of the network of antiparallel β-sheet interactions (Ref. 15 and this work) lead to the fibrillar state, where five-stranded β-sheet monomers are packed in a parallel, in-register fashion (10).

