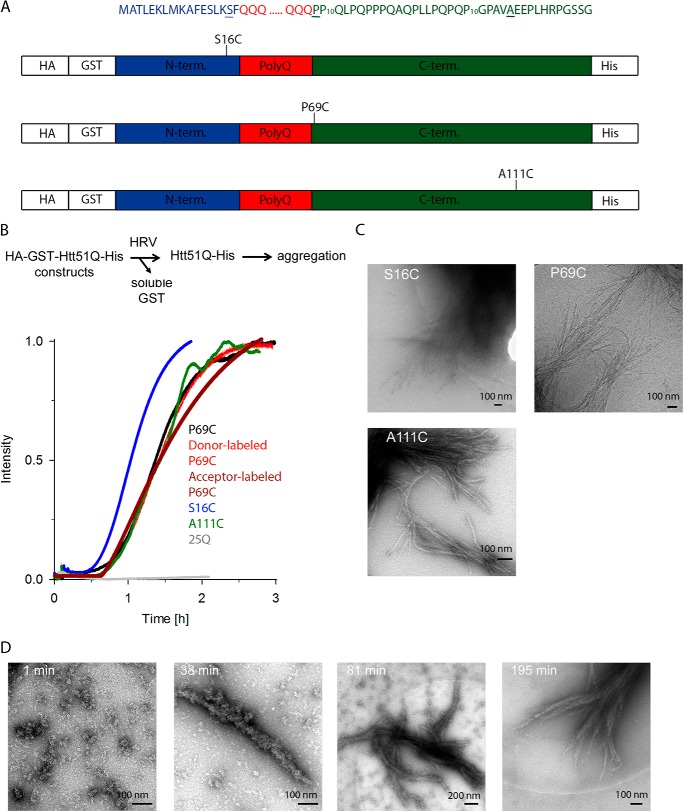
FIGURE 1.
Aggregation kinetics of Htt51Q mutants. A, schematic of the constructs used in this study. The amino acid sequences of the three regions of Htt exon 1, the 17-amino acid-long N terminus (blue), polyQ part (red), and C terminus (green), are color-coded as in the schematic. Residues mutated to Cys at which fluorescent labels were introduced are underlined, and their position relative to the polyQ stretch is designated on the schematics. Numbering is according to the primary sequence of Htt51Q. HA and His tags are used to monitor expression levels of the constructs. B, Cys mutations or fluorescent labeling did not alter the aggregation kinetics of Htt51Q. Aggregation is initiated by the addition of HRV protease, which recognizes the cleavage site downstream of the GST moiety as designated on the reaction schematic. Exemplary aggregation kinetics traces monitored by light scattering of unlabeled Htt51Q mutants and donor-labeled or acceptor-labeled P69C variant are shown. The variant with polyQ stretch below the pathological threshold, Htt25Q, did not aggregate (gray). C, cryo-EM images of end stage fibrils of different Htt51Q mutants. S16C and P69C fibrils were imaged at 48 h and A111C fibrils were imaged at 12 h of the aggregation time course. D, electron microscopy images (negative staining) of P69C at various time points in the aggregation time course.

