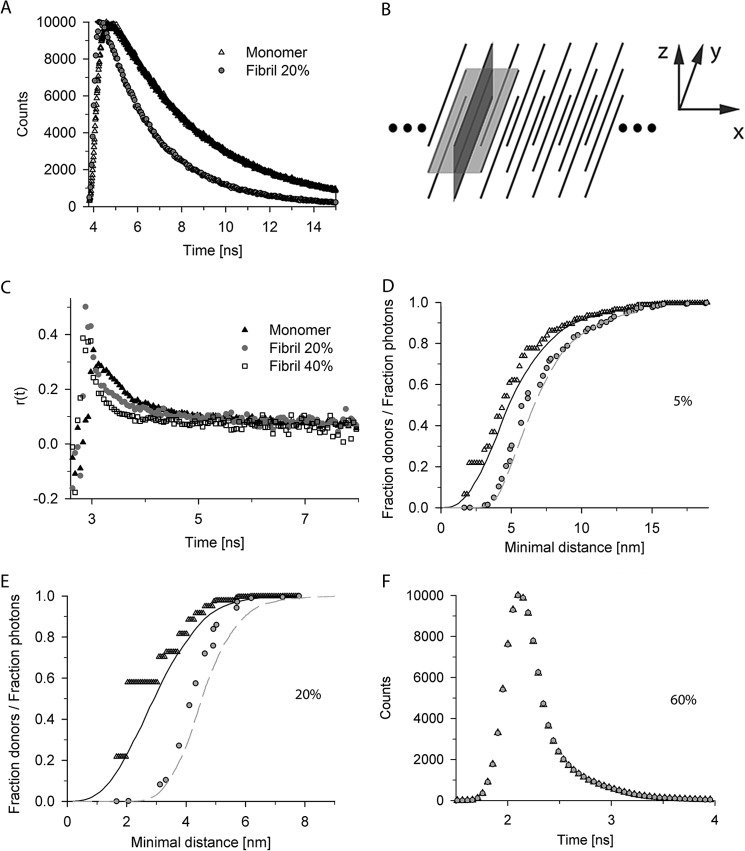
FIGURE 2.
Fluorescent time decay curves. A, the fluorescent time decay curves for monomer and aggregates differ. Typical fluorescent decay time curves for 20% donor-labeled P69C monomer and fibrils (Fibril 20%) are shown. B, general reference system for discussion of structural details: x axis denotes the fibril axis, y axis denotes the direction of the β-strands, and z axis denotes the direction of the monomer layers (by β-sheet) or monomers (by zipper) perpendicular to the fibril axis. β-Sheet according to Sikorski and Atkins (16) lies in the x/y-plane (light gray plane), and zipper structures according to Schneider et al. (14) are in the y/z-plane (dark gray plane). C, The mobility of the fluorescent dye is not restricted as revealed by anisotropy measurements for donor-labeled S16C monomer, fibrils containing 20% (Fibril 20%), or 40% (Fibril 40%) of donor-labeled S16C monomers. D–F, cumulative curves of distance distributions of donors to their closest acceptor for fixed (open black triangle) and flexible (black solid line) dye positions and the relative contribution of the photons derived from these donor fractions to the total signal in the first time interval in the simulations with fixed (gray filled circle) and flexible (gray dashed line) dye positions. The flexible dye positions were modeled with a 2-nm linker to additionally enhance the dye flexibility. The discrete values in two exemplary simulations of fibrils containing donor-labeled S16C monomer and 5% (D) or 20% (E) acceptor-labeled S16C are shown. F, impact of the photons derived from donors with acceptor in a very close proximity (<0.5R0). Simulations are of 20% donor-labeled S16C und 60% acceptor-labeled S16C fibrils. There is negligible difference between convoluted simulations with (black open triangle) and without (gray filled circle) photons collected from donors with acceptors closer than the half of the Förster radius.

