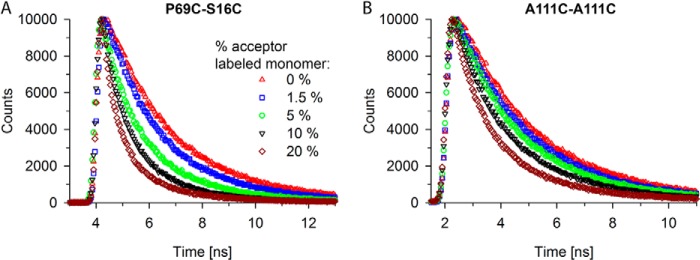
FIGURE 3.

Time-resolved fluorescent decay time measurements of Htt51Q fibrils. A and B, two distinct exemplary measurements for fibrils of P69C-S16C (A) and A111C-A11C (B). A, fibrils contain 20% of P69C monomer labeled with the donor dye and increasing concentrations (from 1.5 to 20%) of S16C monomer labeled with the acceptor dye. B, fibrils contain 20% of A111C monomers labeled with the donor dye and increasing concentrations (from 1.5 to 20%) of A111C monomer labeled with the acceptor dye. The symbols in the legend of panel A apply to both panels. Note that the depicted two exemplary measurements illustrate the subtle but significant changes in the fluorescent decay time traces depending on the labeling position of the donor or acceptor dye.
