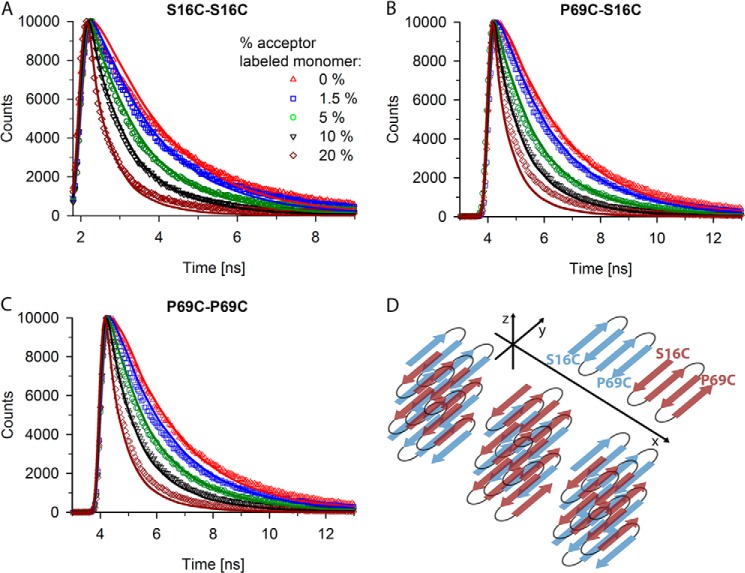
FIGURE 4.
Fluorescent decay curves fit well to five-layered β-sheet of four-stranded monomer. A–C, experimental (various symbols) and simulated (line) fluorescence decay curves for fibrils containing 20% S16C monomer labeled with donor dye and increasing concentrations (from 1.5 to 20%) of S16C monomer labeled with the acceptor dye (A), for fibrils containing 20% P69C monomer labeled with donor dye and increasing concentrations (from 1.5 to 20%) of S16C monomer labeled with the acceptor dye (B), and for fibrils containing 20% P69C monomer labeled with donor dye and increasing concentrations (from 1.5 to 20%) of P69C monomer labeled with the acceptor dye (C). The symbols in panel A represent the increase in the acceptor-labeled monomer and apply to all panels. D, the structural model used in simulations of A–C is composed of a five-layered β-sheet of monomers with alternating N-terminal orientation along the y axis but the same orientation along the x axis. Note that only the polyQ stretches and not the whole Htt exon 1 are presented; the polyQ stretch of each monomer adopts four β-strands. Two exemplary monomers are depicted with the position of the mutations flanking the polyQ stretch to illustrate the parallel orientation of a monomer to each neighbor in the β-sheet.

