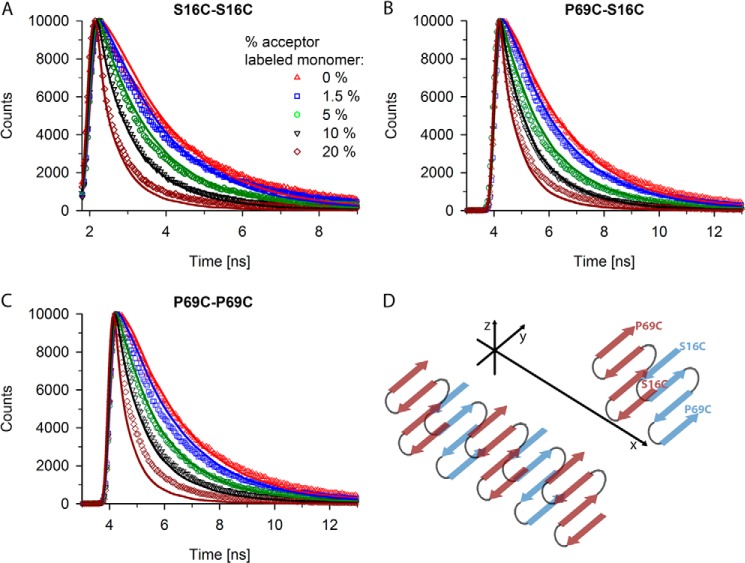
FIGURE 5.
Fluorescent decay curves also fit reasonably to zipper structure. A–C, experimental (various symbols) and simulated (line) fluorescence decay curves for fibrils containing 20% S16C monomer labeled with donor dye and increasing concentrations (from 1.5 to 20%) of S16C monomer labeled with the acceptor dye (A), for fibrils containing 20% P69C monomer labeled with donor dye and increasing concentrations (from 1.5 to 20%) of S16C monomer labeled with the acceptor dye (B), and for fibrils containing 20% P69C monomer labeled with donor dye and increasing concentrations (from 1.5 to 20%) of P69C monomer labeled with the acceptor dye (C). The symbols in panel A represent the increase in the acceptor-labeled monomer and apply to all panels. D, schematic of an antiparallel zipper structure with four strands of the polyQ stretch, each layer perpendicular to fibril growth direction (x axis) and N termini aligned on one side. Note that only the polyQ stretches and not the whole Htt exon 1 are presented in panel D. Two exemplary monomers are depicted with the position of the mutations flanking the polyQ stretch to illustrate the antiparallel orientation of a monomer to each neighbor in the zipper.

