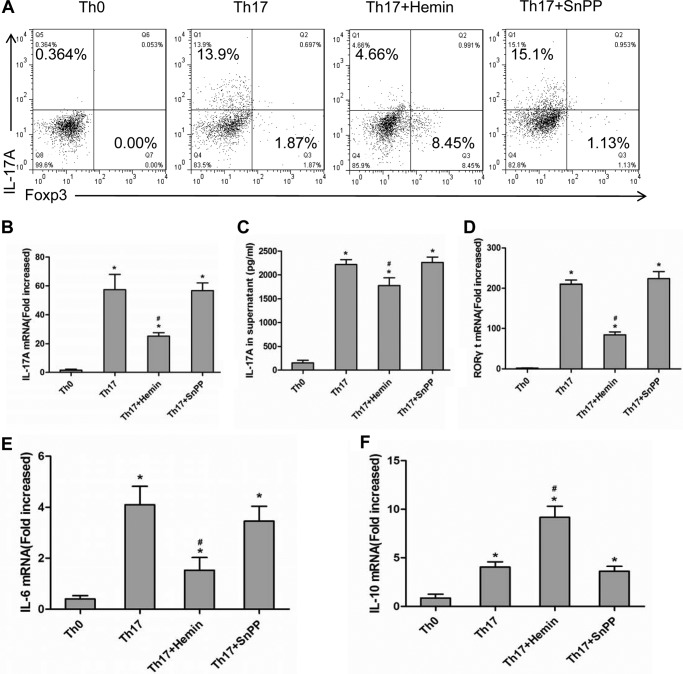
FIGURE 5.
Induction of HO-1 switched naive T cell differentiation from Th17 to Treg cells in vitro. A, flow cytometric analysis of magnetically purified naive T cells from spleens of BALB/c mice cultured under Th17-skewing conditions with or without hemin or SnPP (30 nmol/ml) for 5 days. Numbers in upper left quadrants indicate the percentages of Th17 (CD4+ IL-17+) cells gated on CD4+ T cells. Numbers in lower right quadrants indicate the percentages of Tregs (CD4+ Foxp3+) gated on CD4+ T cells. B, qRT-PCR analysis of IL-17A mRNA in cells cultured in vitro. Data are presented as mean ± S.D. C, ELISA analysis of IL-17A in supernatants of cultured cells. Data are presented as mean ± S.D. D, qRT-PCR analysis of RORγt mRNA in cultured cells in vitro. E, qRT-PCR analysis of IL-6 mRNA in cultured cells in vitro. Data are presented as mean ± S.D. F, qRT-PCR analysis of IL-10 mRNA in cultured cells in vitro. Data are presented as mean ± S.D. (*, compared with Th0 group, *, p < 0.05; #, with Th17 group, #, p < 0.05). All results shown are representative of three independent experiments.

