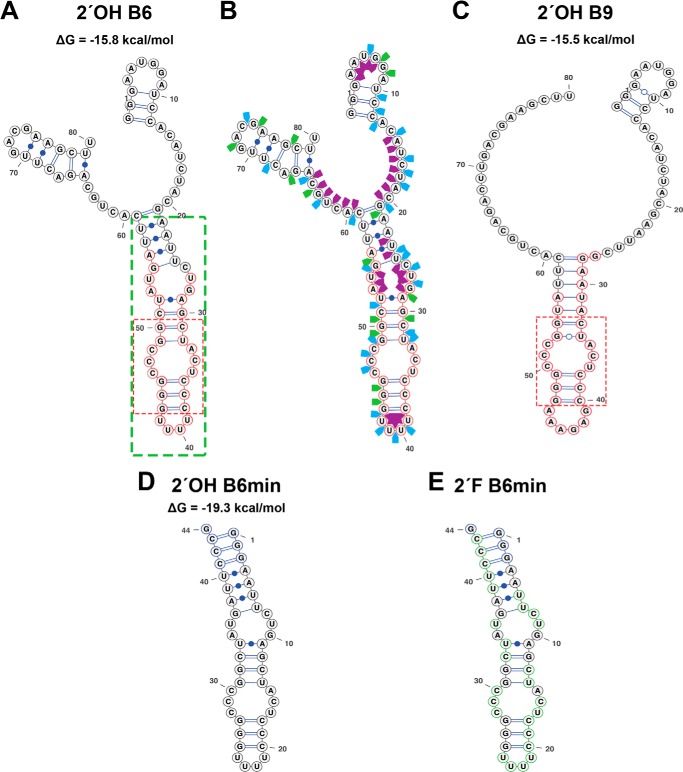
FIGURE 3.
Secondary structures of the B6 and B9 aptamers. A, the Mfold secondary structure prediction of the full-length B6 aptamer with the nucleotides within the green box showing the region truncated to create the B6min aptamer sequence. Nucleotides circled in red define the random region. B, enzymatic solution structure probing of the full-length B6 transcript with the random region highlighted in red. Cleavage sites by the G-specific RNase T1 (green arrows), U and C-specific RNase A (blue arrows), and single-stranded RNA specific S1 nuclease (purple arrows) are shown. C, the Mfold of the full-length B9 aptamer with the selected region highlighted as described in A. The dotted red boxes in A and C showed the conserved sequences and secondary structure elements of both aptamers. D, secondary structure of 2′ OH B6min. E, 2′F B6min stem loops. These have additional 5′-GGG and 3′-CCCG sequences added to increase their folded stability. 2′F pyrimidines are circled in green in E.

