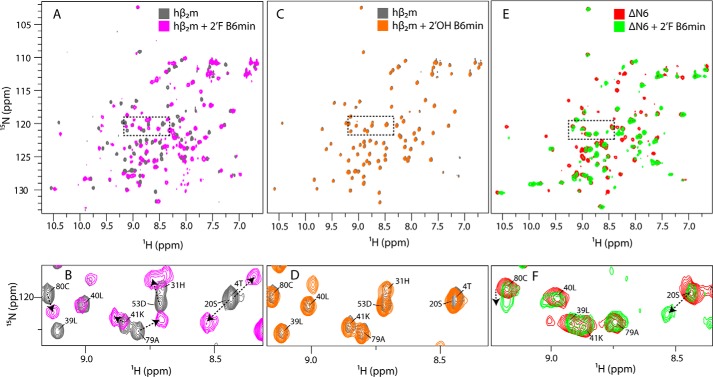
FIGURE 5.
Chemical shift changes upon the addition of aptamers to hβ2m and ΔN6. A, the 1H-15N HSQC spectrum of 15N,13C-labeled hβ2m (60 μm) alone (gray) or in the presence of two molar equivalents of 2′F B6min (magenta). B, expansion of the region boxed in A. C, the 1H-15N HSQC spectrum of 15N,13C-labeled hβ2m (60 μm) alone (gray) or in the presence of two molar equivalents of 2′OH B6min (orange). D, expansion of the region boxed in C. E, the 1H-15N HSQC spectrum of 15N,13C-labeled ΔN6 (60 μm) alone (red) or in the presence of two molar equivalents of 2′F B6min (green). F, expansion of the region boxed in E. Chemical shift changes in B, D, and F are annotated with arrows. All spectra were obtained at 25 °C, pH 6.2.

