FIGURE 7.
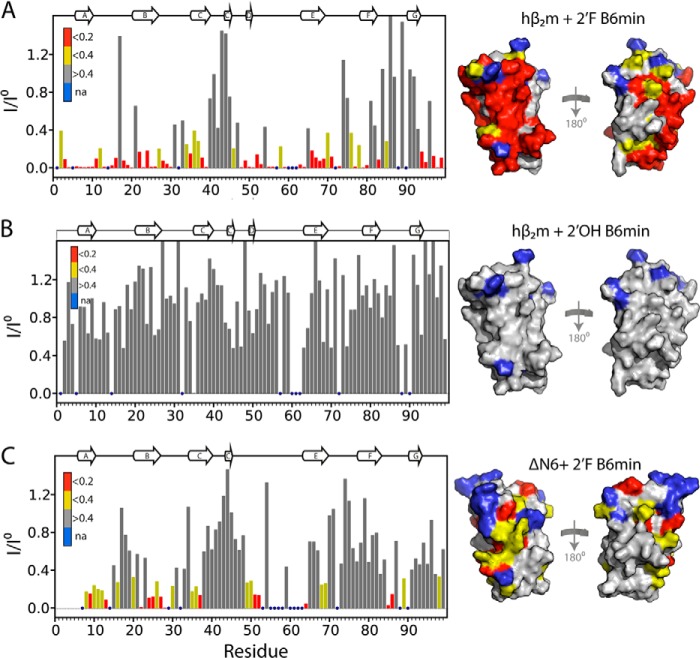
2′F B6 distinguishes between two highly similar proteins. A, plot of the loss of signal intensity of resonances in native hβ2m upon binding to a 2-fold molar excess of 2′F B6min using data shown in Fig. 5A. Profiles were calculated as the ratio of the peak intensity in the presence (I) or absence (Io) of a 2-fold molar excess of aptamer. Intensity profiles were normalized to residues 40–45 that are not involved in the interface. Residues with a ratio of <0.2 are colored red, those showing a ratio between 0.2 and 0.4 are colored yellow, and those with no significant decrease in intensity are colored gray. The structure of hβ2m drawn as a surface representation is shown on the right color-coded using the same scale. Residues with no assignments (na) are shown in blue. B, as described in A, but for the interaction of 2′OH B6min and hβ2m. C, as described in A, but for the interaction of 2′F Β6min with ΔΝ6. The secondary structure elements of the proteins are shown as ribbons on top of the panels.

