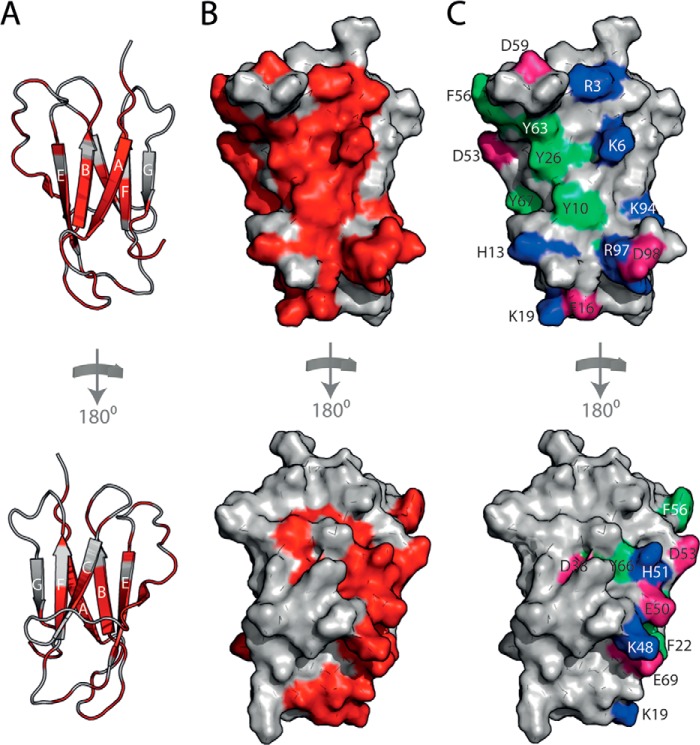
FIGURE 8.
Mapping the 2′F B6min-hβ2m binding site. A, the residues in hβ2m that show the largest decrease in intensity upon interaction with 2′F B6min are shown in red on the structure of hβ2m (gray schematic) and predominantly involve residues in the A, B, E, and D β-strands of hβ2m. By contrast, the C, F, and G β-strands show relatively little change in intensity (bottom). B, surface representation of hβ2m highlighting the interface residues (red). C, the 2′F B6min-hβ2m binding interface involves seven aromatic residues (light green), seven positively charged residues (blue), and seven negatively charged residues (pink).

