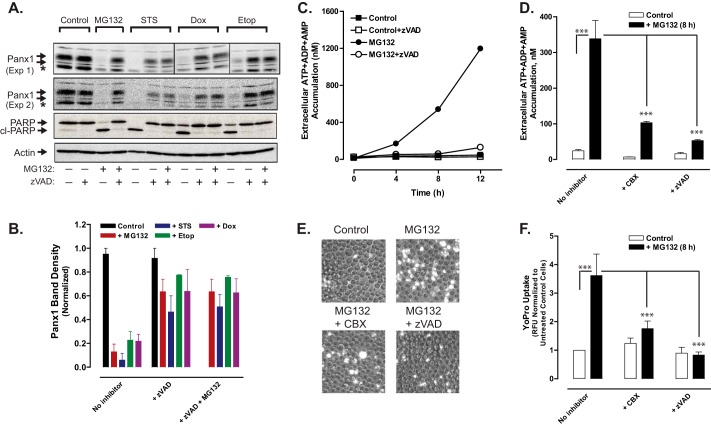
FIGURE 9.
Proteosome inhibition induces caspase-3-mediated cleavage of the pannexin-1 C-terminal autoinhibitory domain and pannexin-1-mediated release of adenine nucleotides. A, Jurkat T cells were treated with no stimulus, 3 μm MG132, 3 μm STS, 20 μm Etop, or 25 μm Dox in the absence or presence of 100 μm Z-VAD or combined 100 μm Z-VAD plus 3 μm MG132 for 12 h. Aliquots were taken for Western blot analysis of Panx1, PARP1, and actin. Panx1 blots are from two separate experiments; PARP and actin blots are representative of both experiments; * indicates nonspecific immunoreactive band. B, densitometric quantification of Panx1 bands in Western blots from A; bands were normalized to the densities of the control cell samples for each experiment. C, Jurkat cells were incubated with no stimulus or 3 μm MG132 in the absence or presence of 100 μm Z-VAD. At the indicated times, samples of the extracellular medium were processed for analysis of summed ATP + ADP + AMP. Data indicate mean ± S.E. from one experiment performed in triplicate. D, Jurkat T cells were incubated with no stimulus or with 3 μm MG132 for 8 h in the absence or presence of 100 μm Z-VAD or 100 μm CBX. Samples of the extracellular medium were processed for analysis of summed ATP + ADP + AMP. Data indicate mean ± S.E. for n = 3–9 wells from three experiments; ***, p < 0.001. E and F, Jurkat T cells were incubated with no stimulus or with 3 μm MG132 for 8 h in the absence or presence of 100 μm Z-VAD. Samples of the extracellular medium were processed for analysis of YoPro accumulation (in the absence or presence or 100 μm CBX) as described in Fig. 3. E, representative phase-contrast and epifluorescence microscopy images. F, data indicate mean ± S.E. for n = 6 wells from two experiments; ***, p < 0.001.

