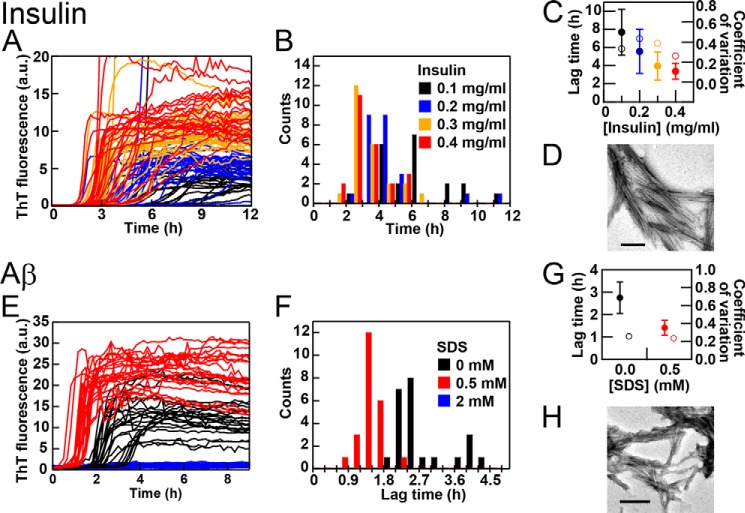
FIGURE 4.
Performance of HANABI with insulin (A–D) and Aβ(1–40) (E–H) with plate movements. A–C, kinetics (A), histograms of the lag time (B) and means ± S.D. for the lag time (closed circles) and coefficients of variation (open circles) (C) at 0.1 (black), 0.2 (blue), 0.3 (orange), and 0.4 (red) mg/ml insulin in 3.0 m GdnHCl and 5 μm ThT at pH 2.5 and 37 °C. A microplate with 96 wells was used, with 24 wells for each insulin concentration. D, TEM image of insulin fibrils formed at 0.2 mg/ml insulin. E–G, kinetics (E), histograms of the lag time (F), and means ± S.D. for the lag time and coefficients of variation (G) at 10 μm Aβ(1–40) in the absence (black) and presence of 0.5 (red) or 2.0 (blue) mm SDS in 100 mm NaCl and 5 μm ThT at pH 7.0 and 37 °C. H, TEM image of Aβ(1-)40 fibrils formed in the presence of 0.5 mm SDS. Scale bars = 200 nm. a.u., arbitrary units.

