
FIGURE 5.
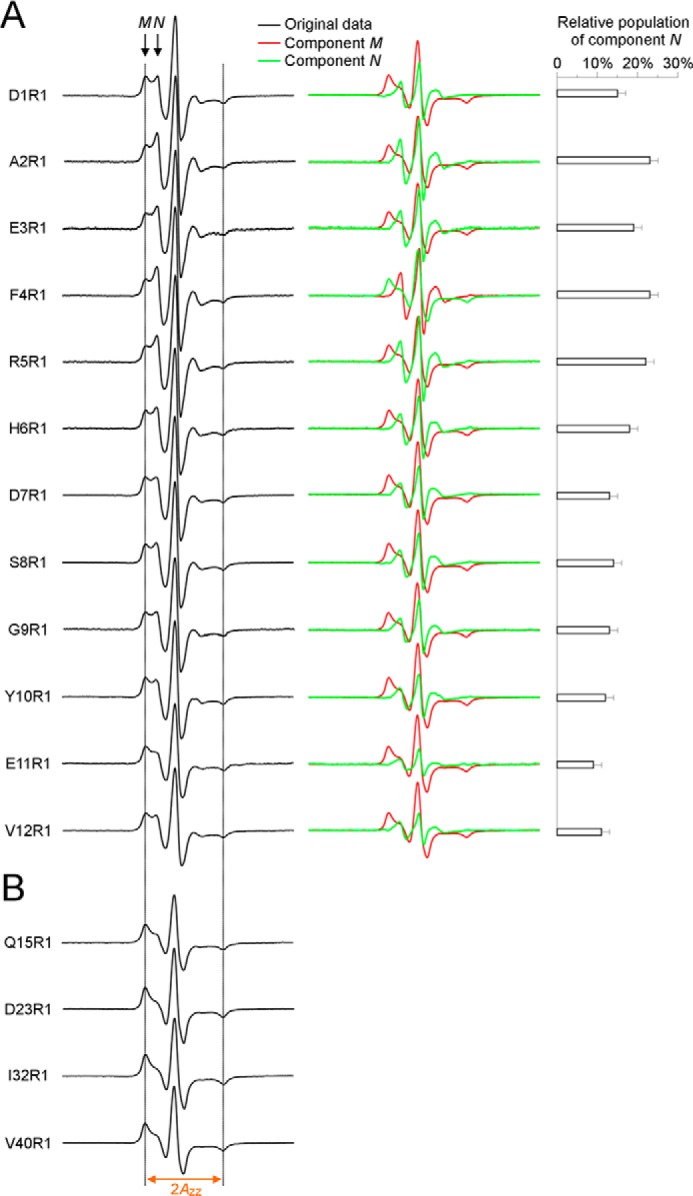
Spectral subtraction reveals a partially ordered structure for the N-terminal residues 1–12 in oligomers. A, EPR spectra at labeling sites 1–12 contain two spectral components M and N (arrows). Using the average EPR spectrum of Q15R1, D23R1, I32R1, and V40R1 as an approximation of component M, we obtained the lineshape of component N by subtracting component M from the experimental spectra. The component N accounts for 9–23% of total population, depending on the labeling sites. Dotted lines are drawn as visual aid to compare spectra. B, spectral lineshape is similar for the ordered residues 15, 23, 32, and 40, with similar 2Azz values. The same 2Azz is observed for the component M of spectra at residues 1–12, suggesting that the lineshape of component M may be similar as these ordered residues. Because of the similarity of these ordered spectra, an average spectrum was used as the approximation for the component M.