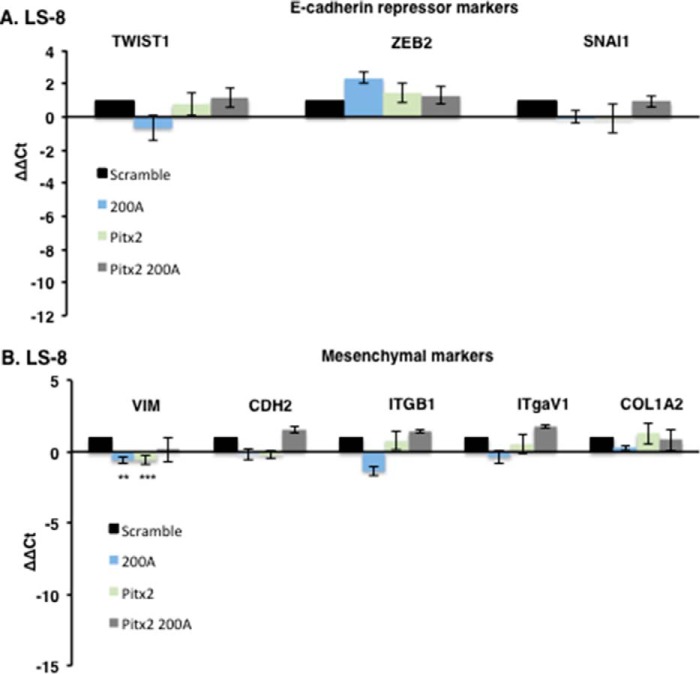
FIGURE 8.
FACS sorted transduced LS-8 cells were analyzed for specific gene expression. A, the E-cadherin repressor genes Twist1, Zeb2, and Snail1 were all increased in the Pitx2-miR-200a-transduced cells (n = 3). B, mesenchymal markers were not increased above scrambled control cells, and the expression levels were low (>Ct 30; n = 3).

