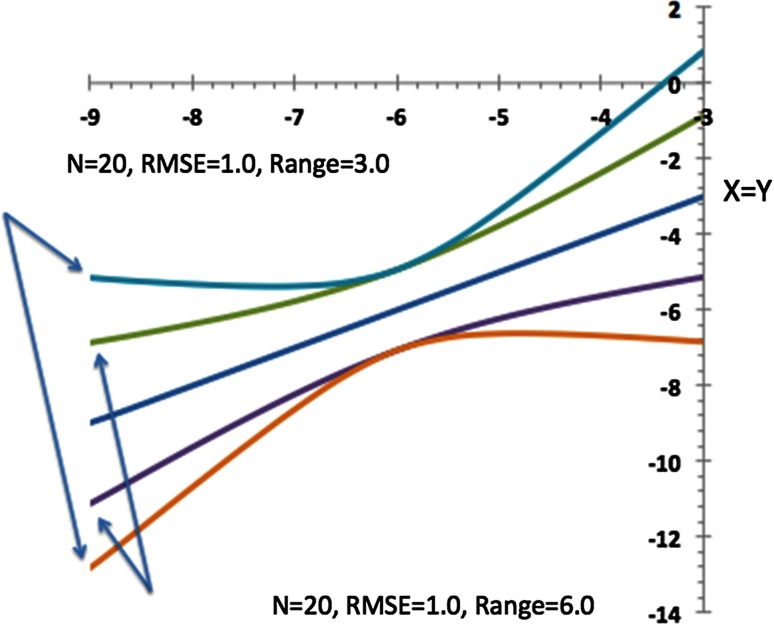
Fig. 7.
A graph showing the expected 95 % confidence limits for predictions from a linear fit. The central line is “X = Y” and represents the achieved fit to twenty data points (N = 20). The two lines bracketing “X = Y” show the 95 % confidence limits for predictions made from this line when the net RMSE = 1.0 across a data range of 6.0 U, about a median of x = −6.0. The two outer lines represent the same limits but for a data range of 3.0, about a median of x = −6.0 again

