

Abstract
The capsid of hepatitis B virus (HBV) is a major viral antigen and important diagnostic indicator. HBV capsids have prominent protrusions (‘spikes’) on their surface and are unique in having either T =3 or T =4 icosahedral symmetry. Mouse monoclonal and also human polyclonal antibodies bind either near the spike apices (historically the ‘α-determinant’) or in the ‘floor’ regions between them (the ‘β-determinant’). Native mass spectrometry (MS) and gas-phase electrophoretic mobility molecular analysis (GEMMA) were used to monitor the titration of HBV capsids with the antigen-binding domain (Fab) of mAb 3120, which has long defined the β-determinant. Both methods readily distinguished Fab binding to the two capsid morphologies and could provide accurate masses and dimensions for these large immune complexes, which range up to ~8 MDa. As such, native MS and GEMMA provide valuable alternatives to a more time-consuming cryo-electron microscopy analysis for preliminary characterisation of virus-antibody complexes.
Keywords: Native MS, GEMMA, Hepatitis B, Virus-antibody complexes, Quasi-equivalence, Immune complex
Introduction
Hepatitis B virus (HBV) is a major cause of liver disease. In spite of the development of effective vaccines and antivirals for the prevention and treatment of HBV infections, the disease remains a serious health concern. Chronic infection elicits production of large amounts of anti-capsid antibodies, motivating studies to better understand the interaction of the HBV capsid antigen with anti-capsid antibodies. In HBV capsids, the capsid protein (Cp) forms, both in vitro and in vivo, particles with two icosahedrally symmetric morphologies, corresponding to the triangulation numbers T =4 and T =3 and consisting of 240 and 180 monomeric subunits, respectively [1]. Cp dimers are the building blocks for capsid formation and are stabilised by an intermolecular four-helix bundle and a disulphide bond within the bundle (Cys61) [2–4]. Together, these two capsids are known as the hepatitis B core antigen (HBcAg). At a structural level, interaction of HBcAg with a number of antibodies has been investigated, mainly by cryo-electron microscopy (cryo-EM) [5–11]. T =4 capsids have four quasi-equivalent variants of each epitope (designated A, B, C, D) whereas T =3 capsids have only three (A, B, C), all present in 60 copies per capsid. Note, however, that similarly named sites (e.g. the B-epitope on T =3 and the B-epitope on T =4) are not necessarily equivalent [12]. Data indicate both, that epitopes are quite diverse and that there can be pronounced variations in binding affinity between quasi-equivalent variants of a given epitope. The majority of mapped epitopes exist as conformational discontinuous epitopes, although one conformational linear epitope and one non-conformational linear epitope have also been observed [13, 14]. The locations of the majority of these epitopes have been mapped to the upper region of the four-helix bundle that constitutes the capsid spike. However, a distinct epitope has been identified for the monoclonal antibody 3120 [15]. Characterisation by cryo-EM of Fab 3120-binding mapped its epitope to the floor region of the capsids, and pronounced differences in the occupancies of the seven quasi-equivalent variants of the epitope (from 0 to 100 %) were observed, reflecting differences in affinity arising from nuances in structure [15]. Since Fab 3120 detects, and has historically defined, the β-epitope on HBcAg [5], it is commonly used in diagnostic assays. Furthermore, the antibody is specific for assembled capsids and does not bind to dimeric capsid subunits [16]. Among the human antibodies isolated from HBV clinical sera, some were shown to have a similar binding fingerprint [11], indicating that 3120-like antibodies are a major component of the anti-HBcAg response to HBV infection.
Following the introduction of electrospray ionisation [17], native mass spectrometry (MS) has emerged as a valuable technique for the characterisation of protein assemblies in terms of molecular weight (Mw), stoichiometry and structure. Application of this methodology to a variety of macromolecular systems, including viral particles [18–21], heterogeneous protein assemblies [22, 23] and membrane-bound protein assemblies [24], has demonstrated that many structural properties of large non-covalent protein complexes can be partially preserved in the gas phase. Ion mobility mass spectrometry (IMMS) has more recently been coupled to native MS and yields additional information relating to size, shape and charge [25–29]. Next to native MS, gas-phase electrophoretic mobility molecular analysis (GEMMA) has emerged as an alternative method to characterise macromolecular particles such as protein complexes, viruses and virus-antibody complexes [30–38]. Both approaches commence with electrospray ionization (ESI) of protein assemblies from a pseudophysiological buffer (e.g. aqueous ammonium acetate). In native MS, the multiply charged ions that are produced undergo extensive desolvation and are subsequently separated by predominantly time-of-flight (ToF) mass analysers. In GEMMA, the initial ESI process is followed by charge manipulation that reduces the particles to singly charged ions that are separated by their electrophoretic mobility diameter (EMD) at atmospheric pressure, which corresponds to particle size in the case of globular analytes. Finally, they are detected by vapour condensation on the separated singly charged particles with subsequent laser light scattering [31, 39].
In this study, we used a combination of ESI-based techniques, MS and GEMMA, to probe the interaction of Fab 3120 with HBcAg. We demonstrate the potential of these techniques for monitoring the concentration-dependent antibody-antigen binding process. We show that interactions of Fab 3120 with HBcAg can be maintained in the gas phase, enabling the separation and semi-quantitative monitoring of HBcAg-Fab complexes in the megadalton mass range. Most significantly, both techniques have the ability to distinguish between Fab 3120 binding to T =3 and T =4 capsids. Our native MS and GEMMA data were found to be in close agreement and consistent with earlier measurements made at a single Fab 3120/HBcAg dimer ratio by cryo-EM [15]. As such, they establish a proof-of-concept for analysing such virus-antibody immune complexes, qualitatively and semi-quantitatively by ESI.
Materials and methods
Preparation of HBcAg capsids and Fab fragments and decoration of capsids with Fab
The Cp construct used, Cp149.3CA, consists of residues 1 to 149 in which the cysteines at positions 48, 61 and 107 have been changed to alanines. Cp149.3CA (abbreviated to Cp149 dimer) was expressed and purified in dimeric form as previously described [40]. Assembly into capsids was achieved via buffer exchange into aqueous ammonium acetate (200 mM) at pH 6.8 using an Amicon Ultra 0.5 mL centrifugal filter (Millipore, Billerica, MA) with a Mw cut-off of 5 kDa. Monoclonal antibody 3120 was purchased from the Institute of Immunology, Tokyo, Japan. Proteolytic digestion and purification of Fab 3120 was as previously reported [15]. Expression and purification of Fab E1 has been previously described [41]. Both Fab fragments were also buffer exchanged into aqueous ammonium acetate (200 mM) at pH 6.8. Capsids were decorated by mixing Fab with HBcAg at ratios of Fab/Cp149 dimer from 0:1 to 6:1. In the case of GEMMA measurements, assembly of intact capsids was achieved via buffer exchange into aqueous ammonium acetate (50 mM) at pH 6.8, as described above. The maximum mixing ratio used in GEMMA measurements of Fab-decorated capsids corresponded to a Fab/Cp149 dimer of 4:1.
Native mass spectrometry analysis
High resolution (tandem) mass spectra were recorded on a modified Q-ToF instrument (Waters, Manchester, UK) in positive ion mode [42]. Xenon was used as the collision gas to increase the transmission of the HBcAg-Fab complexes [43], and voltages and other gas pressures were optimised for large non-covalent protein complexes [44, 45]. Briefly, the capillary and cone voltages were kept constant at 1.25 kV and 150 V, respectively. The voltage before the collision cell (collision energy (CE)) was varied between 100 and 150 V for MS analysis. Ions were introduced into the source at a pressure of 10 mbar. Measurements at the different Fab to HBcAg mixing ratios were carried out either in duplicate or triplicate. In cases where charge state resolution was achieved for HBcAg, masses were determined for all ions detected in the charge state distribution. Since charge state resolution was not obtained for the Fab-bound HBcAg complexes, the m/z at maximum ion intensity for the T =3 and T =4 distributions was determined by multi-peak fitting of two Gaussian curves to the observed ion distributions using the software IGORPro [46]. Fab occupancy of HBcAg was deduced by comparison of the experimentally observed m/z (at maximum signal intensity) for the T =3 and T =4 capsids with the theoretical m/z predicted for all possible Fab occupancies up to a maximum of 90 Fab for T =3 capsids and 120 Fab for T =4 capsids. The smallest deviation between the theoretical m/z and the experimentally observed m/z determines the occupancy (see Electronic Supplementary Material Fig. S1). Calculation of the theoretical m/z of these complexes was achieved using a previously published correlation between mass and charge state [20] (see Electronic Supplementary Material Fig. S2). Errors, associated with defining the Fab occupancy, were estimated from the reproducibility of repeat measurements and averaged to encompass errors associated with measurements at pre-saturation and saturation mixing ratios.
Ion mobility (IM) measurements were performed on a Synapt HDMS G1 (Waters, Manchester, UK) [26, 28]. Generation of gas phase ions from native protein solution was achieved using a capillary voltage of 1.25 kV, cone voltage of 150 V and source pressure of 13.6 mbar. Argon was used as background gas, in both the trap and transfer T-Wave cells, at a flow rate of 3 mL/min with applied collision voltages of 120 and 80 V, respectively. Nitrogen was used in the IM cell for separation of ions by their mobility at a flow rate of 22 mL/min, a velocity of 250 m/s and ramped wave height of 2–25 Vover 60 % of the IM separation (IMS) cycle. Collisional cross sections (CSSs) were determined using the experimentally measured IM drift times and through calibration with proteins of known cross sections [18, 19, 27, 47, 48]. Reported CCS values represent the average drift time across the ion distribution corresponding to a given HBcAg-Fab complex. The measurements were repeated at least twice.
ESI tips were prepared in-house from borosilicate glass tubes of 1.2 mm (outer diameter) by 0.68 mm (inner diameter) (World Precision Instruments, Sarasota, FL) using a P-97 micropipette puller (Sutter Instruments, Novato, CA). The ESI tips were gold coated using a Scancoat six Pirani 501 sputter coater (Edwards Laboratories, Milpitas, CA).
GEMMA analysis
GEMMA was carried out on an instrument (TSI Inc., Shoreview, MN) consisting of a nanoelectrospray source with a Po-210 charge reduction device (model 3480), an electrostatic classifier with a nanodifferential mobility analyzer (model 3080), and a butanol-driven condensation particle counter (model 3025A). HBcAg-Fab assemblies were electrosprayed from 0.5 mL Protein LoBind tubes (Eppendorf, Hamburg, Germany) via a cone-tipped fused silica capillary with 25 μm inner diameter (TSI Inc.) by application of ~2.09±0.02 kV (resulting in ~−394±17 nA current), 0.10 L/min CO2, 0.50 L/min particle-free air and a pressure difference of ~290 mbar across the capillary. GEMMA spectra were recorded in the range 3–50 nm EMD by application of 15 L/min sheath flow and 120 s scan time. The resulting median values of ten GEMMA spectra were plotted. To assign the EMD value of a given peak, the peak apex was determined via fitting of a Gauss curve (Origin 8.6 software, Northampton, MA).
Determining the Fab occupancy of proteinaceous capsids by GEMMA depends on several geometric considerations [37]. In the case of the HBcAg-Fab complexes, the surface area of a sphere with a radius halfway between the unbound HBcAg and the HBcAg-Fab complex at saturation (AHBVcomplex) was calculated. We initially employed an ellipsoidal shape for the Fab, with an ellipsoid height derived from GEMMA data and an ellipsoid radius of 2.5 nm [49]. However, upon formation of a saturated HBcAg-Fab complex, we did not observe an EMD consistent with the EMD of HBcAg plus twice the EMD of Fab, but instead a significantly lower value. We therefore considered compression of the Fab ellipsoid upon HBcAg binding (at a constant volume of Fab as calculated from its non-compressed form). For this compressed Fab ellipsoid, the maximum circle area at the semi-minor axis (AFabcompr. ellipsoid) was determined. Finally, to obtain the Fab occupancy of a given HBcAg-Fab complex, AHBVcomplex was related to AFabcompr. ellipsoid. Limitations to this approach include the following: (1) whilst the model considers the entire HBcAg surface to be covered by Fab, experimentally this is not the case, (2) attached water and salt residues might lead to an overestimation of the Fab EMD (an important basis of calculation) and (3) the actual HBcAg surface topology is not regarded, i.e. capsid deformation upon Fab binding or the Fab binding sites.
Errors associated with defining the Fab occupancy were estimated from the shift in EMD upon repeat measurements of a given HBcAg-Fab complex (EMD shift values of ±1 detection channel resulted in shifts of 0.06 nm for Fab and 0.30 nm for HBV capsids) and standard deviations for peak EMD assignment.
Results and discussion
Monitoring of Fab 3120 binding to HBcAg by native MS
The binding of Fab 3120 to HBcAg capsids was monitored at several Fab 3120/Cp149 dimer molar ratios (Fig. 1). HBcAg alone is observed as two charge-resolved distributions centred around m/z 21,758 and 25,093 Th, and corresponding to the masses of T =3 and T =4 capsids, respectively (Fig. 1a), in line with previously reported data [19]. Upon addition, Fab 3120 binds to both capsid morphologies. Charge state resolution is lost upon Fab binding, which hampers the accuracy of mass determinations. The loss of resolution likely results from two factors: heterogeneity in Fab binding and inefficient desolvation of the electrosprayed complexes [50]. Partial occupancy is observed at mixing ratios of Fab 3120/Cp149 dimer of 0.65:1 (Fig. 1b) resulting in a T =3 capsid with an average m/z at maximum intensity of 23,364 Th and for the T =4 capsid at m/z 27,842 Th. Partial occupancy is also observed at a mixing ratio of 1:1 (Fig. 1c). Saturation is achieved at a Fab 3120/Cp149 dimer ratio of 4:1 for the T = 3 capsid (Fig. 1e), whilst for the T =4 capsid, a significantly lower ratio is sufficient to saturate binding to the capsid (Fig. 1d). We used the shift in m/z to estimate the number of Fab 3120 bound per capsid, following previously described approaches and as described in detail in the “Materials and methods” (see Electronic Supplementary Material Fig. S1 and S2). In this way, the Fab-decorated T =3 capsids were estimated to have an average mass of 5.35 MDa and thus to bind, at saturation, an average complement of 49±4 Fabs. Similarly, decorated T =4 capsids were estimated to have an averaged mass of 7.98 MDa and hence to bind, on average, 83±5 Fabs.
Fig. 1.

Mass spectra corresponding to Fab 3120 binding to HBcAg showing the effect of different mixing ratios of Fab and HBcAg on the HBcAg-Fab assemblies formed. These correspond to the following: (a) 8 μM HBcAg; (b) 0.65:1 (2.6:4 μM) Fab/HBcAg; (c) 1:1 (4:4 μM) Fab/HBcAg; (d) 2:1 (8:4 μM) Fab/HBcAg; (e) 4:1 (16:4 μM) Fab/HBcAg, in 200 mM ammonium acetate, pH 6.8. (HBcAg concentration in terms of Cp149 dimer concentration). The derived Mws of the observed HBcAg-Fab assemblies are indicated by the top axis
Confidence in these numbers is increased by considering the T =3 distribution observed at lower mixing ratios, i.e. less than one Fab per dimer, whereby charge state resolution on the T =3 capsid is achieved at elevated collision voltages (CE). Combining precursor ion isolation of a specific ion in the T =3 charge state distribution with increased CE, charge stripping of the isolated precursor ion allows for the precise determination of the mass and derivation of Fab 3120 occupancy. Good agreement between the occupancies derived from the isolated charge stripped distribution and those calculated from the fitting of a Gaussian curve to the unresolved T =3 distribution in the MS data was obtained. At a Fab 3120/Cp149 dimer of 0.65:1, the average m/z at maximum signal intensity predicts 10 Fab 3120 bind to the T =3 capsid. Isolation of m/z 23,604 Th and subsequent charge stripping at a CE of 150 V led to a distribution also corresponding to ~9 bound Fab 3120 (see Electronic Supplementary Material Fig. S3).
Monitoring Fab 3120 binding to HBcAg by GEMMA
Although native MS and GEMMA share some commonality in their mode of ion generation by ESI, they differ substantially in their means of separation and detection. Specifically, native MS measures the m/z of multiply charged ions, while GEMMA measures the electrophoretic mobility (EM) of singly charged ions (obtained after charge reduction in a bipolar atmosphere), which is subsequently converted to an EMD. In Fig. 2, the HBcAg signals produced by the two approaches are compared. These data compare favourably, with singly charged T =3 and T =4 capsids detected by GEMMA (Fig. 2a), and the highly charged ions of these particles analysed by native MS (Fig. 2b), giving similar values. By MS, an average charge state of the T =3 capsid at +140 and T =4 capsid at +161 are observed (Fig. 2b). Both techniques yield similar values for the ratio of T =3/T =4 capsids, ~1:3. Hence, whilst the mechanisms of particle preparation and analysis are quite different, the results obtained are in good qualitative and quantitative agreement.
Fig. 2.

a GEMMA spectrum corresponding to 2.2 μM HBcAg in 50 mM ammonium acetate, pH 6.8; b Mass spectrum for 8 μM HBcAg in 200 mM ammonium acetate, pH 6.8
Next, a similar set of Fab/HBcAg mixtures was used to monitor the binding of Fab 3120 to HBcAg by GEMMA. As with native MS, Fab-bound capsids were observed at a resolution capable of distinguishing T =3 from T =4 (Fig. 3). As expected, the EMD was observed to increase upon Fab binding, and increasing the amount of Fab 3120 relative to HBcAg led to increased occupancy up to the point of saturation, as also observed by native MS. Employing geometrical considerations (see ‘Materials and methods’), the number of bound Fab could be estimated, giving 38±3 Fabs per T =3 capsid and 56±6 Fabs per T =4 capsid at saturation.
Fig. 3.

Overlay of GEMMA spectra corresponding to 1 μM unbound HBcAg and 2:1 (2:1 μM) Fab 3120/HBcAg (HBcAg in terms of Cp149 dimer concentration). Fab 3120-bound HBcAg has been scaled relative to the HBcAg distribution
Comparing the binding behaviour of Fab 3120 to T =3 and T =4 capsids
The amount of Fab 3120 bound by HBcAg depends on the relative amount of Fab available (Fig. 1). However, native MS and GEMMA both show that T =3 and T =4 capsids differ in their saturation points for Fab binding. T =3 capsids saturate at a Fab 3120/Cp149 dimer ratio of 2.4:1±0.1, compared to the near-stoichiometric ratio of 1.4:1±0.1 for T =4 capsids (Fig. 4). To better understand this difference, it is necessary to consider the geometry of the capsids. On the T =4 capsid of the six potential epitope sites around each twofold axis (each bridging the B–C, D-B and C–D subunit interfaces), cryo-EM has shown that only the C–D epitopes are occupied and they occlude the other four sites [15] (Fig. 5). In addition, of the five A-A epitopes around each fivefold axis, only one is occupied and the Fab bound there occludes the other four sites. In the case of the T =3 capsid, the proposed binding is different (Fig. 5). No binding is observed at any of the six potential sites around the threefold axis, and two of the five sites around each fivefold axis are occupied owing to a change in binding aspect vis-à-vis the T =4 capsid. Hence, these major differences in the mode of binding between the quasi-equivalent sites of the two capsids correlates with the larger molar excess of Fab 3120 required for T =3 saturation compared to T =4. It is likely that the differing occupancies reflect the differing affinities and consequently, the amount of Fab required for saturation. This decrease in affinity for Fab binding to the T =3 capsid may be due to slight distortion of the 3120 epitope, perhaps an alteration of the angles between two adjacent dimers by the greater curvature of the T =3 lattice.
Fig. 4.

Occupancy of T =3 capsids (a and c) and T =4 capsids (b and d) by Fab 3120 at different mixing ratios of Cp149 dimer/Fab 3120, as derived from MS (a and b) and GEMMA (c and d) measurements. Error bars on the MS data represent multiple measurements for a given mixing ratio. GEMMA measurements were averaged prior to the determination of the number of bound Fab. Two lines have been fitted to the data; pre-saturation and saturation. The fitted line at saturation is an average of the mixing ratios at which saturation was observed
Fig. 5.
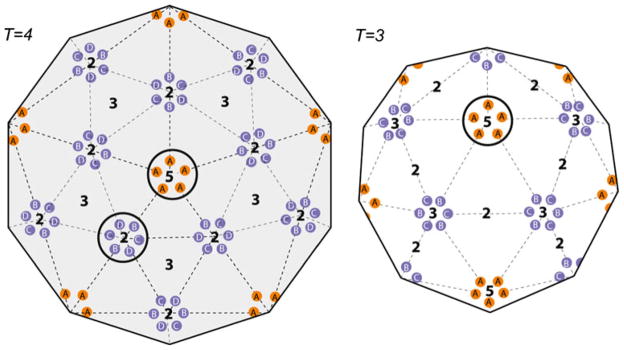
Schematic to illustrate the different quasi-equivalent sites in T =4 and T =3 capsids and regions of Fab 3120 binding. In T =4 capsids, there are four distinct quasi-equivalent environments (A, B, C, D) present at 60 copies each. At the 5-fold axes, there are five A-A epitopes and at the 2-fold axes, there are six quasi-equivalent epitopes, B–C, D-B and C–D (two of each). In T =3 there are three distinct quasi-equivalent environments (A, B, C), present at 60 copies each. At the 5-fold axes, there are five A-A epitopes, at the 3-fold axes, there are six quasi-equivalent epitopes, B–C, C-B (three of each)
Quantitative comparison of the number of Fab 3120 molecules bound to T =3 and T =4 capsids, derived from native MS, GEMMA and cryo-EM (Fig. 6) shows reasonable agreement. We feel the observed discrepancies originate more from uncertainties inherent to a given technique, since the technical reproducibility within a single method is very high (estimated at ±~10 % of the occupancy). From this data, we see that native MS overestimates the occupancy compared to cryo-EM and this likely results from non-specific adduct formation and the lack of a suitable calibration method, whereby appropriate calibrants at the masses associated with the HBcAg-Fab complexes are not readily available (see Electronic Supplementary Material Fig. S2). It has been well documented that during the ESI process, the increase in ligand concentration that occurs during the desolvation process of droplets can lead to non-specific binding [21, 51]. A similar reasoning can be used for cases where GEMMA also overestimates the occupancy (also see ‘Materials and methods’), although GEMMA and cryo-EM seem to agree within the determined error range. On the other hand, cryo-EM data may underestimate the amount of Fab bound, since there is a detection threshold. These data are based on measuring ratios of Fab density to Cp density in the reconstruction (the latter is assumed to have 100 % occupancy). Fabs bound at low occupancies beneath this threshold cannot be distinguished from background noise. For these reconstructions, we estimate this threshold to be about 15 % [15]. This means that there might be up to six undetected Fabs per T =3 capsid bound to the apparently unoccupied sites around its threefold axes (6=20×2×0.15). The calculation envisages two potential bindings per threefold axis (of which there are 20), as around the twofold axis on the T =4 capsid [15]. This consideration of potential underestimation does not apply to the other potential sites for epitope 3120, which are all taken to have 100 % occupancy, subject to mutual occlusion effects.
Fig. 6.

Comparison of the number of Fab 3120 bound to both T =3 and T =4 capsids (at Fab saturation) as derived from mass spectrometry (M), GEMMA (G) and cryo-EM (E) analysis. The % occupancy is determined by the number of bound Fab 3120 as a ratio of the number of capsid dimers (90 for T =3 and 120 for T =4)
Nevertheless, it is significant that all techniques indicate a higher degree of binding for the T =4 capsid compared to the T =3 capsid which is in good agreement with our observations of Fab 3120 binding more readily to T =4 compared to T =3.
Estimating particle size by IMMS and GEMMA
In addition to providing an estimate of the mass of a particle, MS (and in particular IMMS) and GEMMA can also estimate their size, or diameter, assuming them to be approximately spherical. In IMMS, ions migrate through a neutral buffer gas under the influence of a weak electric field, whereby they separate according to their size, shape and charge [27, 29]. The resulting experimentally determined drift time is converted to a rotationally averaged collisional cross section (CCS), from which the diameter is derived. In GEMMA, the particle diameter can be similarly derived, though in this case from the electrophoretic mobility of singly charged ions through a bipolar gas [31, 39].
IMMS-derived diameters of unbound T =3 and T =4 capsids, 30.5±0.6 nm and 34.3±0.9 nm, respectively (four replicates), are consistent with previously published IMMS data [18] and in good agreement with cryo-EM data, according to which the unbound HBcAg capsids are hollow shells with diameters of 32 nm (T =3) and 36 nm (T =4) [1] (Fig. 7). Furthermore, upon Fab 3120 binding, a similar increase in diameter is observed by IMMS and cryo-EM (Fig. 7). Diameters derived from GEMMA measurements were however considerably smaller than those observed by IMMS or cryo-EM, an effect consistent with previously published GEMMA data [37, 38]. Potential reasons include the desolvation of particles during the GEMMA process [52, 53], although this is unlikely since this effect is not observed in the IMMS data (also obtained at ambient pressure). More probable is the calibration method employed which lacks well-defined values in the high mass region. By scaling the EMD values via a somewhat arbitrary recalibration (multiplicative factor of 1.3 obtained upon comparison of cryo-EM and GEMMA data for unbound HBcAg), the resulting values indicated a more similar increase in HBcAg diameter upon Fab binding as observed by cryo-EM and IMMS (Fig. 7).
Fig. 7.

Comparison of capsid diameters for (1) T =3, (2) T =4, (3) Fab 3120-bound T =3, (4) Fab 3120-bound T =4, as determined by IMMS (M; maximum standard deviation for repeat IMMS measurements= ±0.6 nm), GEMMA (G; GEMMA-derived diameters scaled to the diameters of unbound capsids as determined by cryo-EM) and cryo-EM (E; taken from [1, 15])
That the masses and dimensions obtained by IMMS and GEMMA are in good agreement with those previously obtained in the hydrated state by cryo-EM implies that the structures of the capsids, and the Fabs, are largely retained in vacuo during our MS analysis. That the 3120 epitope is conformational further supports the assumption that the capsids retain much of their native structure in the gas phase.
Monitoring of Fab E1 binding to HBcAg
The potential of MS and GEMMA for rapid characterisation of immune complexes led us to explore the binding of a second antibody, this time directed at the α-determinant, located on the spike. Fab E1 is derived from IgG associated with HBV-induced acute liver failure [54]. The binding of Fab E1 to HBcAg was monitored essentially as described above (see Electronic Supplementary Material Fig. S4 and S5). Native MS and GEMMA indicated similar trends in that occupancy is highly dependent on the amount of Fab available, whereby at low mixing ratios of Fab E1 to HBcAg, HBcAg occupancy is suboptimal and only as the mixing ratios approach stoichiometric amounts is saturation reached (average Fab E1/Cp149 dimer, 1.2:1±0.1 for both T =3 and T =4). Comparison of Fab E1 binding (at saturation) derived from native MS and GEMMA measurements showed good agreement in the relative amounts of Fab E1 that binds the T =4 capsid compared to the T =3 capsid (T =4/T =3 of 1.34 from native MS and 1.32 from GEMMA). These numbers are consistent with the cryo-EM-derived account relating the amount of Fab E1 that binds to the number of available capsid spikes (the ratio of available spikes between the two capsids is 120:90, i.e. 1.33). The similar trends observed for Fab E1 binding to both T =3 and T =4 capsids, with similar mixing ratios required for saturation, suggests that there is a basic difference between the Fab E1 epitope and the 3120 epitope. This may reflect the peripheral location of E1 binding to the spike, whereas the Fab 3120 epitope involves residues from two Cp dimers in the floor region. The increase in capsid diameter upon Fab E1 binding was similar to that observed upon Fab 3120 binding (~20–30 % for both capsid forms), indicating that whilst native MS and GEMMA can detect the increase in diameter, they cannot yet discriminate between the binding of Fabs to different epitopes.
Conclusions
The presence of two different icosahedral capsids (T =3 and T =4) by HBcAg, in vitro and in vivo, is quite unusual in comparison to other viruses, in which the T number tends to be a uniquely defined property. The reason for the formation of these two capsids remains elusive and little is known about their differing properties. Here, we reveal by native MS and GEMMA differences in binding properties of the T =3 and T =4 capsids to a naturally occurring HBV antibody. This capability highlights that there are clear differences between the surface properties of the two capsids that affect their respective antigenicity. Using ESI coupled to native MS and GEMMA, we have shown that complexes of capsids and antibodies can be maintained in the gas phase, even when such particle masses approach 8 MDa. Additionally, we have used MS and GEMMA to monitor the titration of HBcAg with two different Fabs and shown how Fab occupancy of the HBcAg depends on the availability of Fab. This represents a unique application of both native MS and GEMMA and demonstrates that these techniques can be used to rapidly characterise binding interactions. Further refinement of the Fab occupancy could be made using cryo-EM, but only at the cost of increased analysis time. MS and GEMMA have the potential to enable the rapid analysis of very large, heterogeneous and dynamic macromolecular systems.
Supplementary Material
Acknowledgments
This work was supported by the Netherlands Organization for Scientific Research (NWO) with ALW-ECHO (819.02.10) to AJRH. We thank the Netherlands Proteomics Centre, embedded in the Netherlands Genomics Initiative, for financial support. Financial support for the GEMMA experiments was provided by the Austrian Science Foundation (TRP 29-N20) to GA. Additional support was provided by the Intramural Research Program of the National Institute of Arthritis and Musculoskeletal and Skin Diseases at the National Institutes of Health.
Footnotes
Electronic supplementary material The online version of this article (doi:10.1007/s00216-013-7548-z) contains supplementary material, which is available to authorized users.
Contributor Information
Jessica Z. Bereszczak, Biomolecular Mass Spectrometry and Proteomics, Bijvoet Center for Biomolecular Research and Utrecht Institute of Pharmaceutical Sciences, Utrecht University, Padualaan 8, 3584 CH Utrecht, The Netherlands
Marlene Havlik, Institute of Chemical Technologies and Analytics, Vienna University of Technology, Getreidemarkt 9/164, 1060 Vienna, Austria.
Victor U. Weiss, Institute of Chemical Technologies and Analytics, Vienna University of Technology, Getreidemarkt 9/164, 1060 Vienna, Austria
Martina Marchetti-Deschmann, Institute of Chemical Technologies and Analytics, Vienna University of Technology, Getreidemarkt 9/164, 1060 Vienna, Austria.
Esther van Duijn, TNO, P.O. Box 360, 3700 AJ Zeist, The Netherlands.
Norman R. Watts, Protein Expression Laboratory, National Institute of Arthritis, Musculoskeletal and Skin Diseases, National Institutes of Health, Bethesda, MD 20892, USA
Paul T. Wingfield, Protein Expression Laboratory, National Institute of Arthritis, Musculoskeletal and Skin Diseases, National Institutes of Health, Bethesda, MD 20892, USA
Guenter Allmaier, Institute of Chemical Technologies and Analytics, Vienna University of Technology, Getreidemarkt 9/164, 1060 Vienna, Austria.
Alasdair C. Steven, Laboratory of Structural Biology, National Institute of Arthritis, Musculoskeletal and Skin Diseases, National Institutes of Health, Bethesda, MD 20892, USA
Albert J. R. Heck, Email: a.j.r.heck@uu.nl, Biomolecular Mass Spectrometry and Proteomics, Bijvoet Center for Biomolecular Research and Utrecht Institute of Pharmaceutical Sciences, Utrecht University, Padualaan 8, 3584 CH Utrecht, The Netherlands
References
- 1.Crowther RA, Kiselev NA, Bottcher B, Berriman JA, Borisova GP, Ose V, Pumpens P. Three-dimensional structure of hepatitis B virus core particles determined by electron cryomicroscopy. Cell. 1994;77(6):943–950. doi: 10.1016/0092-8674(94)90142-2. [DOI] [PubMed] [Google Scholar]
- 2.Bottcher B, Wynne SA, Crowther RA. Determination of the fold of the core protein of hepatitis B virus by electron cryomicroscopy. Nature. 1997;386(6620):88–91. doi: 10.1038/386088a0. [DOI] [PubMed] [Google Scholar]
- 3.Conway JF, Cheng N, Zlotnick A, Wingfield PT, Stahl SJ, Steven AC. Visualization of a 4-helix bundle in the hepatitis B virus capsid by cryo-electron microscopy. Nature. 1997;386(6620):91–94. doi: 10.1038/386091a0. [DOI] [PubMed] [Google Scholar]
- 4.Wynne SA, Crowther RA, Leslie AG. The crystal structure of the human hepatitis B virus capsid. Mol Cell. 1999;3(6):771–780. doi: 10.1016/s1097-2765(01)80009-5. [DOI] [PubMed] [Google Scholar]
- 5.Takahashi K, Machida A, Funatsu G, Nomura M, Usuda S, Aoyagi S, Tachibana K, Miyamoto H, Imai M, Nakamura T, Miyakawa Y, Mayumi M. Immunochemical structure of hepatitis B e antigen in the serum. J Immunol. 1983;130(6):2903–2907. [PubMed] [Google Scholar]
- 6.Ferns RB, Tedder RS. Human and monoclonal antibodies to hepatitis B core antigen recognise a single immunodominant epitope. J Med Virol. 1986;19(2):193–203. doi: 10.1002/jmv.1890190213. [DOI] [PubMed] [Google Scholar]
- 7.Petit MA, Capel F, Riottot MM, Dauguet C, Pillot J. Antigenic mapping of the surface proteins of infectious hepatitis B virus particles. J Gen Virol. 1987;68(Pt 11):2759–2767. doi: 10.1099/0022-1317-68-11-2759. [DOI] [PubMed] [Google Scholar]
- 8.Belnap DM, Watts NR, Conway JF, Cheng N, Stahl SJ, Wingfield PT, Steven AC. Diversity of core antigen epitopes of hepatitis B virus. Proc Natl Acad Sci U S A. 2003;100(19):10884–10889. doi: 10.1073/pnas.1834404100. [DOI] [PMC free article] [PubMed] [Google Scholar]
- 9.Harris A, Belnap DM, Watts NR, Conway JF, Cheng N, Stahl SJ, Vethanayagam JG, Wingfield PT, Steven AC. Epitope diversity of hepatitis B virus capsids: quasi-equivalent variations in spike epitopes and binding of different antibodies to the same epitope. J Mol Biol. 2006;355(3):562–576. doi: 10.1016/j.jmb.2005.10.035. [DOI] [PubMed] [Google Scholar]
- 10.Watts NR, Cardone G, Vethanayagam JG, Cheng N, Hultgren C, Stahl SJ, Steven AC, Sallberg M, Wingfield PT. Non-canonical binding of an antibody resembling a naive B cell receptor immunoglobulin to hepatitis B virus capsids. J Mol Biol. 2008;379(5):1119–1129. doi: 10.1016/j.jmb.2008.04.009. [DOI] [PMC free article] [PubMed] [Google Scholar]
- 11.Kandiah E, Watts NR, Cheng N, Cardone G, Stahl SJ, Heller T, Liang TJ, Wingfield PT, Steven AC. Cryo-EM study of hepatitis B virus core antigen capsids decorated with antibodies from a human patient. J Struct Biol. 2012;177(1):145–151. doi: 10.1016/j.jsb.2011.10.003. [DOI] [PMC free article] [PubMed] [Google Scholar]
- 12.Caspar DL, Klug A. Physical principles in the construction of regular viruses. Cold Spring Harbor symposia on quantitative biology. 1962;27:1–24. doi: 10.1101/sqb.1962.027.001.005. [DOI] [PubMed] [Google Scholar]
- 13.Sallberg M, Ruden U, Magnius LO, Harthus HP, Noah M, Wahren B. Characterisation of a linear binding site for a monoclonal antibody to hepatitis B core antigen. J Med Virol. 1991;33(4):248–252. doi: 10.1002/jmv.1890330407. [DOI] [PubMed] [Google Scholar]
- 14.Conway JF, Cheng N, Zlotnick A, Stahl SJ, Wingfield PT, Belnap DM, Kanngiesser U, Noah M, Steven AC. Hepatitis B virus capsid: localization of the putative immunodominant loop (residues 78 to 83) on the capsid surface, and implications for the distinction between c and e-antigens. J Mol Biol. 1998;279(5):1111–1121. doi: 10.1006/jmbi.1998.1845. [DOI] [PubMed] [Google Scholar]
- 15.Conway JF, Watts NR, Belnap DM, Cheng N, Stahl SJ, Wingfield PT, Steven AC. Characterization of a conformational epitope on hepatitis B virus core antigen and quasiequivalent variations in antibody binding. J Virol. 2003;77(11):6466–6473. doi: 10.1128/JVI.77.11.6466-6473.2003. [DOI] [PMC free article] [PubMed] [Google Scholar]
- 16.Watts NR, Vethanayagam JG, Ferns RB, Tedder RS, Harris A, Stahl SJ, Steven AC, Wingfield PT. Molecular basis for the high degree of antigenic cross-reactivity between hepatitis B virus capsids (HBcAg) and dimeric capsid-related protein (HBeAg): insights into the enigmatic nature of the e-antigen. J Mol Biol. 2010;398(4):530–541. doi: 10.1016/j.jmb.2010.03.026. [DOI] [PMC free article] [PubMed] [Google Scholar]
- 17.Fenn JBMM, Meng CK, Wong SF, Whitehouse CM. Electrospray ionization for mass spectrometry of large biomolecules. Science. 1989;246(4926):64–71. doi: 10.1126/science.2675315. [DOI] [PubMed] [Google Scholar]
- 18.Uetrecht C, Versluis C, Watts NR, Wingfield PT, Steven AC, Heck AJ. Stability and shape of hepatitis B virus capsids in vacuo. Angew Chem Int Ed Engl. 2008;47(33):6247–6251. doi: 10.1002/anie.200802410. [DOI] [PMC free article] [PubMed] [Google Scholar]
- 19.Uetrecht C, Versluis C, Watts NR, Roos WH, Wuite GJ, Wingfield PT, Steven AC, Heck AJ. High-resolution mass spectrometry of viral assemblies: molecular composition and stability of dimorphic hepatitis B virus capsids. Proc Natl Acad Sci U S A. 2008;105(27):9216–9220. doi: 10.1073/pnas.0800406105. [DOI] [PMC free article] [PubMed] [Google Scholar]
- 20.Shoemaker GK, van Duijn E, Crawford SE, Uetrecht C, Baclayon M, Roos WH, Wuite GJ, Estes MK, Prasad BV, Heck AJ. Norwalk virus assembly and stability monitored by mass spectrometry. Mol Cell Proteomics. 2010;9(8):1742–1751. doi: 10.1074/mcp.M900620-MCP200. [DOI] [PMC free article] [PubMed] [Google Scholar]
- 21.Robinson CVCEW, Kragelund BB, Knudsen J, Aplin RT, Poulson FM, Dobson CM. Probing the nature of noncovalent interactions by mass spectrometry. A study of protein-CoA ligand binding and assembly. J Am Chem Soc. 1996;118:8646–8653. [Google Scholar]
- 22.Aquilina JA, Benesch JL, Bateman OA, Slingsby C, Robinson CV. Polydispersity of a mammalian chaperone: mass spectrometry reveals the population of oligomers in alphaB-crystallin. Proc Natl Acad Sci U S A. 2003;100(19):10611–10616. doi: 10.1073/pnas.1932958100. [DOI] [PMC free article] [PubMed] [Google Scholar]
- 23.van Duijn E, Bakkes PJ, Heeren RM, van den Heuvel RH, van Heerikhuizen H, van der Vies SM, Heck AJ. Monitoring macromolecular complexes involved in the chaperonin-assisted protein folding cycle by mass spectrometry. Nat Methods. 2005;2(5):371–376. doi: 10.1038/nmeth753. [DOI] [PubMed] [Google Scholar]
- 24.Barrera NP, Isaacson SC, Zhou M, Bavro VN, Welch A, Schaedler TA, Seeger MA, Miguel RN, Korkhov VM, van Veen HW, Venter H, Walmsley AR, Tate CG, Robinson CV. Mass spectrometry of membrane transporters reveals subunit stoichiometry and interactions. Nat Methods. 2009;6(8):585–587. doi: 10.1038/nmeth.1347. [DOI] [PMC free article] [PubMed] [Google Scholar]
- 25.Clemmer DE, Jarrold MF. Ion mobility measurements and their applications to clusters and biomolecules. J Mass Spectrom. 1997;32:577–592. [Google Scholar]
- 26.Giles K, Pringle SD, Worthington KR, Little D, Wildgoose JL, Bateman RH. Applications of a travelling wave-based radiofrequency-only stacked ring ion guide. Rapid Commun Mass Spectrom. 2004;18(20):2401–2414. doi: 10.1002/rcm.1641. [DOI] [PubMed] [Google Scholar]
- 27.Ruotolo BT, Benesch JL, Sandercock AM, Hyung SJ, Robinson CV. Ion mobility-mass spectrometry analysis of large protein complexes. Nat Protoc. 2008;3(7):1139–1152. doi: 10.1038/nprot.2008.78. [DOI] [PubMed] [Google Scholar]
- 28.Thalassinos K, Slade SE, Jennings KR, Scrivens JH, Giles K, Wildgoose JL, Hoyes J, Bateman RH, Bowers MT. Ion mobility mass spectrometry of proteins in a modified commercial mass spectrometer. Int J Mass Spectrom. 2004:236. [Google Scholar]
- 29.Uetrecht C, Rose RJ, van Duijn E, Lorenzen K, Heck AJ. Ion mobility mass spectrometry of proteins and protein assemblies. Chem Soc Rev. 2010;39(5):1633–1655. doi: 10.1039/b914002f. [DOI] [PubMed] [Google Scholar]
- 30.Kaufman SL, Kuchumov AR, Kazakevich M, Vinogradov SN. Analysis of a 3.6-MDa hexagonal bilayer hemoglobin from Lumbricus terrestris using a gas-phase electrophoretic mobility molecular analyzer. Anal Biochem. 1998;259(2):195–202. doi: 10.1006/abio.1998.2644. [DOI] [PubMed] [Google Scholar]
- 31.Bacher G, Szymanski WW, Kaufman SL, Zollner P, Blaas D, Allmaier G. Charge-reduced nano electrospray ionization combined with differential mobility analysis of peptides, proteins, glycoproteins, noncovalent protein complexes and viruses. J Mass Spectrom. 2001;36(9):1038–1052. doi: 10.1002/jms.208. [DOI] [PubMed] [Google Scholar]
- 32.Loo JA, Berhane B, Kaddis CS, Wooding KM, Xie Y, Kaufman SL, Chernushevich IV. Electrospray ionization mass spectrometry and ion mobility analysis of the 20S proteasome complex. J Am Soc Mass Spectrom. 2005;16(7):998–1008. doi: 10.1016/j.jasms.2005.02.017. [DOI] [PubMed] [Google Scholar]
- 33.Hogan CJ, Jr, Kettleson EM, Ramaswami B, Chen DR, Biswas P. Charge reduced electrospray size spectrometry of mega- and gigadalton complexes: whole viruses and virus fragments. Anal Chem. 2006;78(3):844–852. doi: 10.1021/ac051571i. [DOI] [PubMed] [Google Scholar]
- 34.Allmaier G, Laschober C, Szymanski WW. Nano ES GEMMA and PDMA, new tools for the analysis of nanobioparticles-protein complexes, lipoparticles, and viruses. J Am Soc Mass Spectrom. 2008;19(8):1062–1068. doi: 10.1016/j.jasms.2008.05.017. [DOI] [PubMed] [Google Scholar]
- 35.Laschober C, Wruss J, Blaas D, Szymanski WW, Allmaier G. Gas-phase electrophoretic molecular mobility analysis of size and stoichiometry of complexes of a common cold virus with antibody and soluble receptor molecules. Anal Chem. 2008;80(6):2261–2264. doi: 10.1021/ac702463z. [DOI] [PubMed] [Google Scholar]
- 36.Kaufman SL, Skogen JW, Dorman FD, Zarrin F, Lewis KC. Macromolecule analysis based on electrophoretic mobility in air: globular proteins. Anal Chem. 1996;68(11):1895–1904. doi: 10.1021/ac951128f. [DOI] [PubMed] [Google Scholar]
- 37.Guha S, Li M, Tarlov MJ, Zachariah MR. Electrospray-differential mobility analysis of bionanoparticles. Trends Biotechnol. 2012;30(5):291–300. doi: 10.1016/j.tibtech.2012.02.003. [DOI] [PubMed] [Google Scholar]
- 38.Pease LF., 3rd Physical analysis of virus particles using electrospray differential mobility analysis. Trends Biotechnol. 2012;30(4):216–224. doi: 10.1016/j.tibtech.2011.11.004. [DOI] [PubMed] [Google Scholar]
- 39.Kaufman SL. Analysis of biomolecules using electrospray and nanoparticle methods: the gas-phase electrophoretic mobility molecular analyzer (GEMMA) J Aerosol Sci. 1998;29(5/6):537–552. [Google Scholar]
- 40.Zlotnick A, Cheng N, Conway JF, Booy FP, Steven AC, Stahl SJ, Wingfield PT. Dimorphism of hepatitis B virus capsids is strongly influenced by the C-terminus of the capsid protein. Biochemistry. 1996;35(23):7412–7421. doi: 10.1021/bi9604800. [DOI] [PubMed] [Google Scholar]
- 41.Chen Z, Moayeri M, Zhou YH, Leppla S, Emerson S, Sebrell A, Yu F, Svitel J, Schuck P, St Claire M, Purcell R. Efficient neutralization of anthrax toxin by chimpanzee monoclonal antibodies against protective antigen. J Infect Dis. 2006;193(5):625–633. doi: 10.1086/500148. [DOI] [PMC free article] [PubMed] [Google Scholar]
- 42.van den Heuvel RH, van Duijn E, Mazon H, Synowsky SA, Lorenzen K, Versluis C, Brouns SJ, Langridge D, van der Oost J, Hoyes J, Heck AJ. Improving the performance of a quadrupole time-of-flight instrument for macromolecular mass spectrometry. Anal Chem. 2006;78(21):7473–7483. doi: 10.1021/ac061039a. [DOI] [PubMed] [Google Scholar]
- 43.Lorenzen K, Versluis C, van Duijn E, van den Heuvel RH, Heck AJ. Optimizing macromolecular tandem mass spectrometry of large non-covalent complexes using heavy collision gases. Intl J Mass Spectrom. 2007;268:198–206. [Google Scholar]
- 44.Sobott F, Hernandez H, McCammon MG, Tito MA, Robinson CV. A tandem mass spectrometer for improved transmission and analysis of large macromolecular assemblies. Anal Chem. 2002;74(6):1402–1407. doi: 10.1021/ac0110552. [DOI] [PubMed] [Google Scholar]
- 45.Tahallah N, Pinkse M, Maier CS, Heck AJ. The effect of the source pressure on the abundance of ions of noncovalent protein assemblies in an electrospray ionization orthogonal time-of-flight instrument. Rapid Commun Mass Spectrom. 2001;15(8):596–601. doi: 10.1002/rcm.275. [DOI] [PubMed] [Google Scholar]
- 46.IGORPro (version 6.2.2.2) WaveMetrics, Inc; Oregon, U.S.A: [Google Scholar]
- 47.Clemmer DE. Clemmer collisional cross section database. 2008 http://www.indiana.edu/clemmer.
- 48.Bush MF, Hall Z, Giles K, Hoyes J, Robinson CV, Ruotolo BT. Collision cross sections of proteins and their complexes: a calibration framework and database for gas-phase structural biology. Anal Chem. 2010;82(22):9557–9565. doi: 10.1021/ac1022953. [DOI] [PubMed] [Google Scholar]
- 49.Werner TC, Bunting JR, Cathou RE. The shape of immunoglobulin G molecules in solution. Proc Natl Acad Sci U S A. 1972;69(4):795–799. doi: 10.1073/pnas.69.4.795. [DOI] [PMC free article] [PubMed] [Google Scholar]
- 50.Snijder J, Rose RJ, Veesler D, Johnson JE, Heck AJ. Studying 18 MDa virus assemblies with native mass spectrometry. Angew Chem Int Ed Engl. 2013;52(14):4020–4023. doi: 10.1002/anie.201210197. [DOI] [PMC free article] [PubMed] [Google Scholar]
- 51.Wang W, Kitova EN, Klassen JS. Influence of solution and gas phase processes on protein-carbohydrate binding affinities determined by nanoelectrospray Fourier transform ion cyclotron resonance mass spectrometry. Anal Chem. 2003;75(19):4945–4955. doi: 10.1021/ac034300l. [DOI] [PubMed] [Google Scholar]
- 52.Kaddis CS, Lomeli SH, Yin S, Berhane B, Apostol MI, Kickhoefer VA, Rome LH, Loo JA. Sizing large proteins and protein complexes by electrospray ionization mass spectrometry and ion mobility. J Am Soc Mass Spectrom. 2007;18(7):1206–1216. doi: 10.1016/j.jasms.2007.02.015. [DOI] [PMC free article] [PubMed] [Google Scholar]
- 53.Thomas JJ, Bothner B, Traina J, Benner WH, Siuzdak G. Electrospray ion mobility spectrometry of intact viruses. Spectroscopy. 2004;18:31–36. [Google Scholar]
- 54.Wu W, Chen Z, Cheng N, Watts NR, Stahl SJ, Farci P, Purcell RH, Wingfield PT, Steven AC. Specificity of an anti-capsid antibody associated with hepatitis B Virus-related acute liver failure. J Struc Biol. 2013;18:53–60. doi: 10.1016/j.jsb.2012.10.004. [DOI] [PMC free article] [PubMed] [Google Scholar]
- 55.van Breukelen B, Barendregt A, Heck AJR, van den Heuvel RHH. Resolving stoichiometries and oligomeric states of glutamate synthase protein complexes with curve fitting and simulation of electrospray mass spectra. Rapid Commun Mass Spectrom. 2006;20(16):2490–2496. doi: 10.1002/rcm.2620. [DOI] [PubMed] [Google Scholar]
Associated Data
This section collects any data citations, data availability statements, or supplementary materials included in this article.