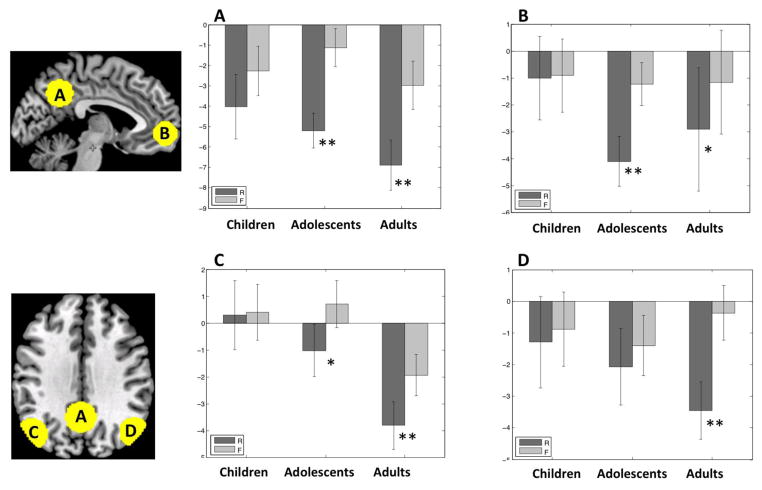
Figure 3.
Subsequent memory deactivations in the DMN in each age group. A = PCC; B = MPFC; C = LLP; D = RLP. Dark grey bars represent trials in which a scene was later remembered (R). Light grey bars represent trials in which a scene was later forgotten (F). Error bars are standard errors of the mean. ** p < .01 for R < F. * p < .05 for R < F.

