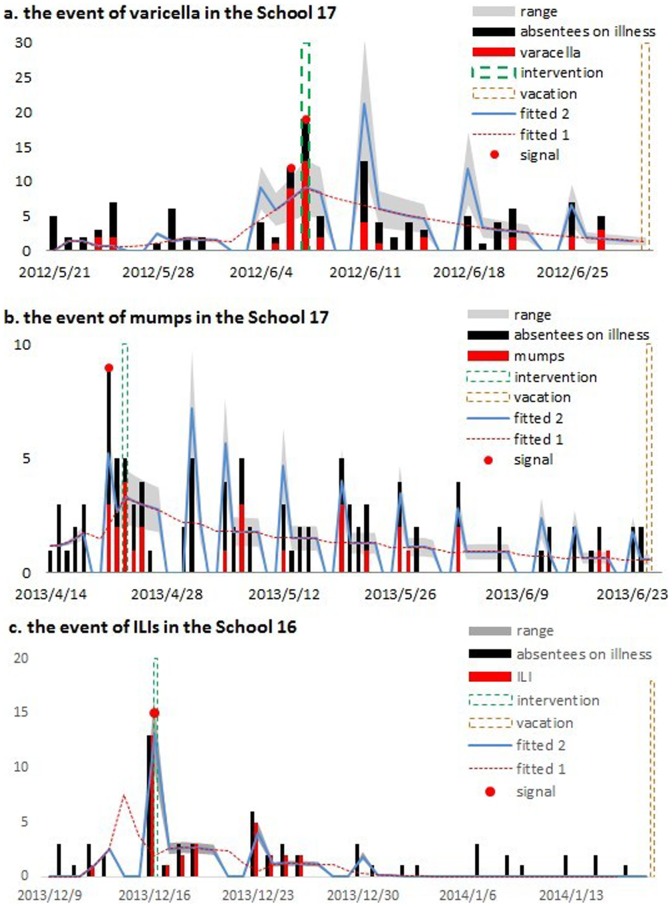
Figure 4. Model fit of epidemics in (a) varicella outbreak, (b) mumps outbreak, and (c) influenza-like illness outbreak.
Vertical dash lines indicate the timing of control measures and vacations. Red dots indicate alarms by warning algorithm. ‘Fitted 1’ is the fitted line generated directly using impulse SEIR model; ‘Fitted 2’ is the fitted line adjusted by the effect of suspending reporting on weekends.

