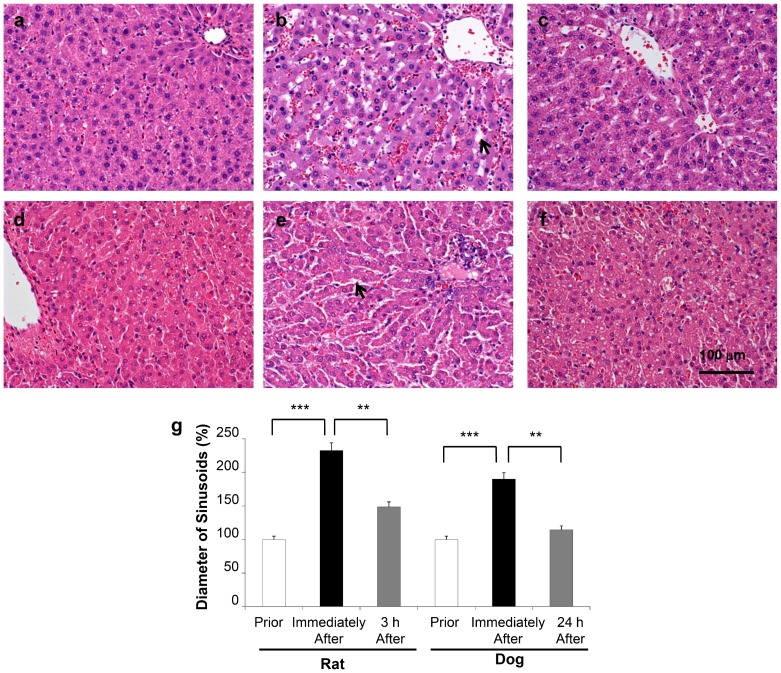
Figure 3. Impact of liver-targeted hydrodynamic gene delivery on hepatic sinusoidal structure.
Hematoxylin and eosin staining was performed on the liver sample before (a), immediately following (b), and 3 h (c) after the liver-targeted hydrodynamic gene delivery in rats, and prior to (d), immediately following (e), and 24 h (f) after the liver-targeted hydrodynamic gene delivery in dogs. Scale bar represents 100 µm. (g) Quantitative measurement of hepatic sinusoidal areas. Three different liver sections from 3 rats (n = 9) and 2 dogs (n = 6) were stained and images were captured. Quantitative analysis was performed using ImageJ software (version 1.6.0_20, National Institutes of Health, USA). The values represent mean ± SD. ** p<0.01, *** p<0.001 by ANOVA and Bonferroni's multiple comparison test.

