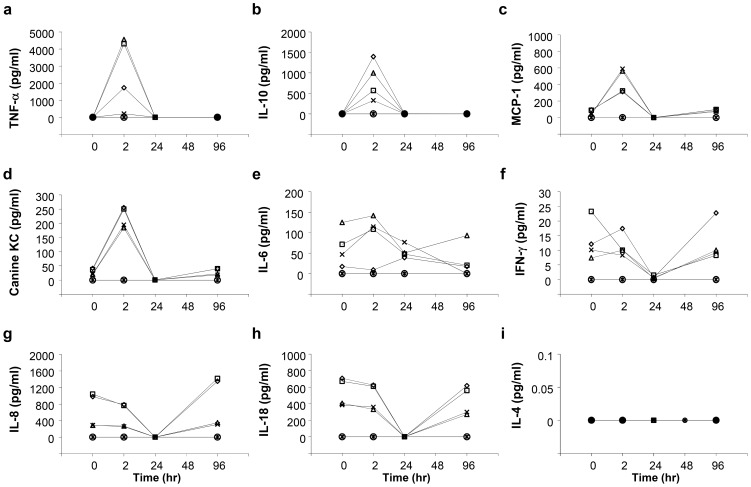
Figure 6. Impact of the procedure on serum cytokine levels.
Blood samples were collected from the cephalic or saphenous veins of dogs before (time = 0), and 2, 24, 48, 96 h after the first hydrodynamic injection of saline (white diamond), pCAG-hAAT (white square), pBS-HCRHP-FIXIA (white triangle), pCMV-Luc (black cross) or slow drip infusion of the same volume of saline from peripheral vein within 1 h (white circle) or 2 h (black asterisk). Concentrations of TNF-α (a), IL-10 (b), MCP-1 (c), Canine KC (d), IL-6 (e), IFN-γ (f), IL-8 (g), IL-18 (h), IL-4 (i). The values represent mean (n = 2 for each group).

