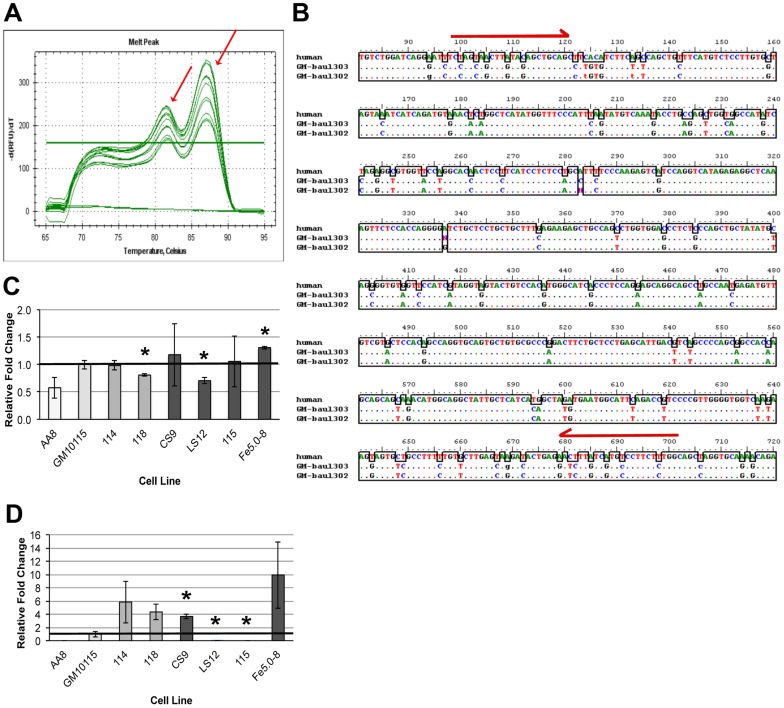
Figure 2. NFκB gene expression.
A) Melt curve for NFκB qRT-PCR with the two PCR products indicated by red arrows. B) Sequence mismatch between human and CHO PCR products. Red arrows indicate species specific primer sites. C) CHO and D) human NFkB gene expression relative to the parental GM10115 cell line. Columns represent mean + SE for three experiments; * P<0.05, 2-tailed t-test.

