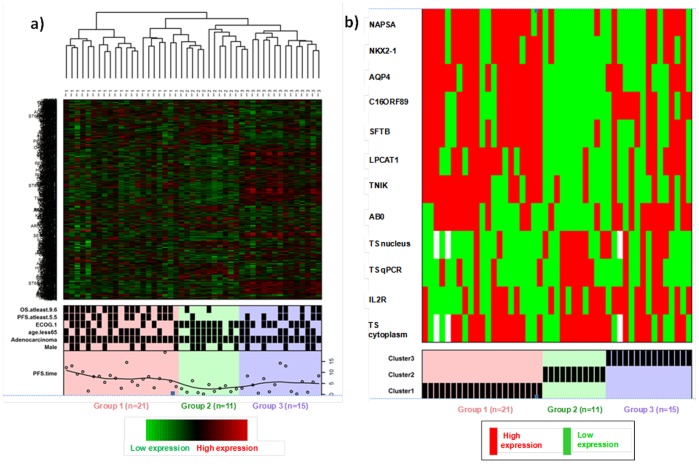
Figure 1. Cluster analysis: Heatmap profiles of adenocarcinoma patients with microarray mRNA data (n = 47).
1a: Columns of the heatmap represent the samples with annotated cluster membership. Rows of the heatmap represent the 870 genes on the Lung Cancer-DSA microarray in common with the set of genes used by Wilkerson et al. [2012]. Additional binary profiles are plotted for the following covariates: male, adenocarcinoma yes, ECOG performance status = 1, PFS ≥5.5 months (median), OS ≥9.6 months (median), PFS time is plotted as an additional profile with added loess-smoothed curve. 1b: Binary profiles plotted for TS nucleus IHC H-score high (≥70), TS cytoplasm IHC H-score high (≥100), TS qPCR high (≥-1.3), and high expression (≥ median cutpoint) of each of the 9 genes significantly associated with both PFS and OS in the overall sample. Abbreviations: ECOG, Eastern Cooperative Oncology Group; n, number of patients; nsNSCLC, nonsquamous non-small cell lung cancer; OS, overall survival; PFS, progression-free survival; qPCR, real-time quantitative polymerase chain reaction; TS, thymidylate synthase.

