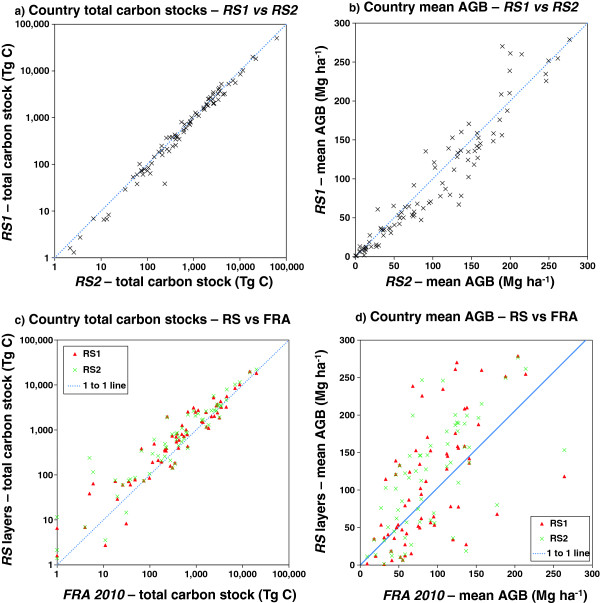
Figure 4.

A comparison of carbon stocks and mean aboveground biomass (AGB) values by country for RS1 , RS2 and the FAO Forest Resource Assessment (FRA) 2010: a) Country total carbon stocks – RS1 vs RS2 ; b) Country mean AGB – RS1 vs RS2 ; c) Country total carbon stocks – RS1 & RS2 vs FRA; d) Country mean AGB – RS1 & RS2 vs FRA.
