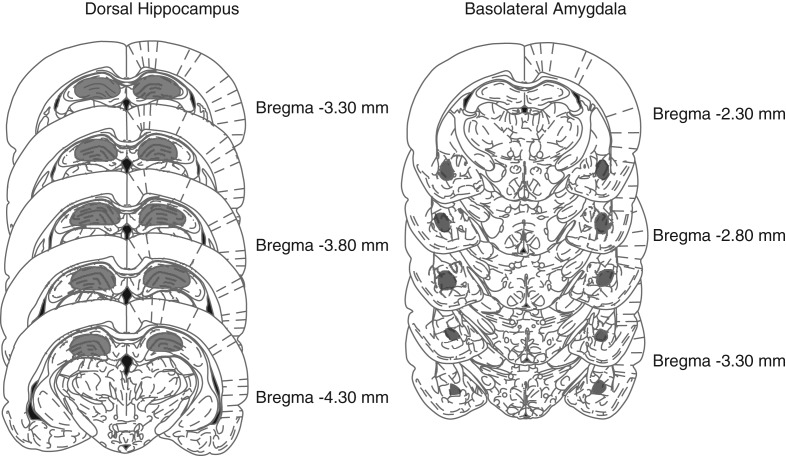
Figure 6.
Schematic representations of injection sites into the dorsal hippocampus and BLA at the indicated rostrocaudal planes. The numbers represent the coordinates from bregma (in millimeters) according to Paxinos and Watson (2007). Injections sites were contained within the gray-shaded areas. (Reprinted from Paxinos and Watson 2007 with permission from Elsevier © 2007.)

