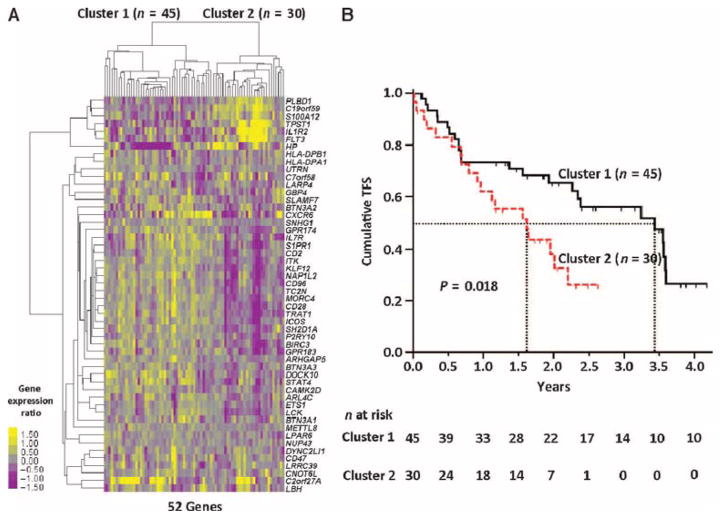
Fig. 2. Hierarchical clustering discriminates subgroups with outcome differences in the replication cohort.
(A) Hierarchical clustering of IPF patients from the replication cohort (n = 75) based on the 52-gene signature found in the discovery cohort to be associated with TFS (FDR <5%, Cox score ≥2.5 and ≤−2.5). Two major clusters of IPF patients were identified. Every row represents a gene, and every column, a patient. Color scale is shown adjacent to heat map in log2 scale; generally, yellow denotes increase over the geometric mean of samples, and purple, decrease. (B) TFS differs between clusters in the replication cohort; the median survival of each group is depicted in dotted vertical lines; n at risk is the number of IPF patients at risk of death or lung transplant at the beginning of each time point. P value was determined by the log-rank test.

