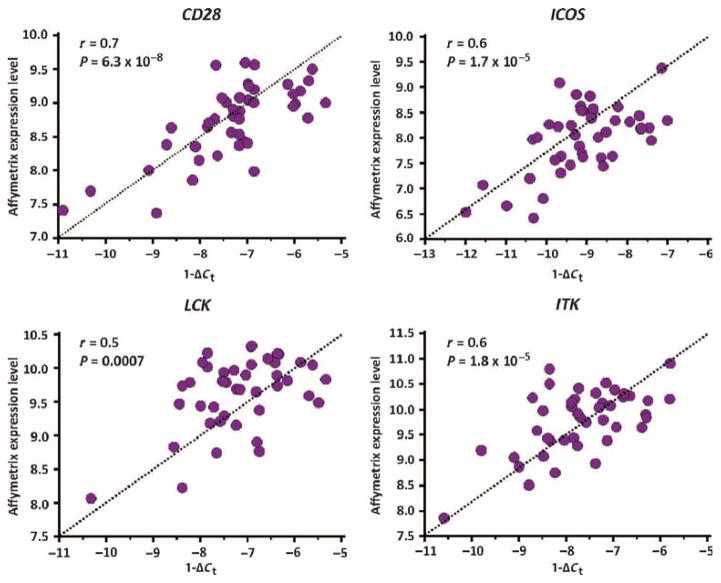
Fig. 3. qRT-PCR confirms microarray findings in the discovery cohort.
Correlation between log2-transformed microarray gene expression values and corresponding SmartChip qRT-PCR expression levels for CD28, ICOS, LCK, and ITK in patients (n = 43) from the discovery cohort. P values were determined by Student’s t distribution for Pearson correlation.

