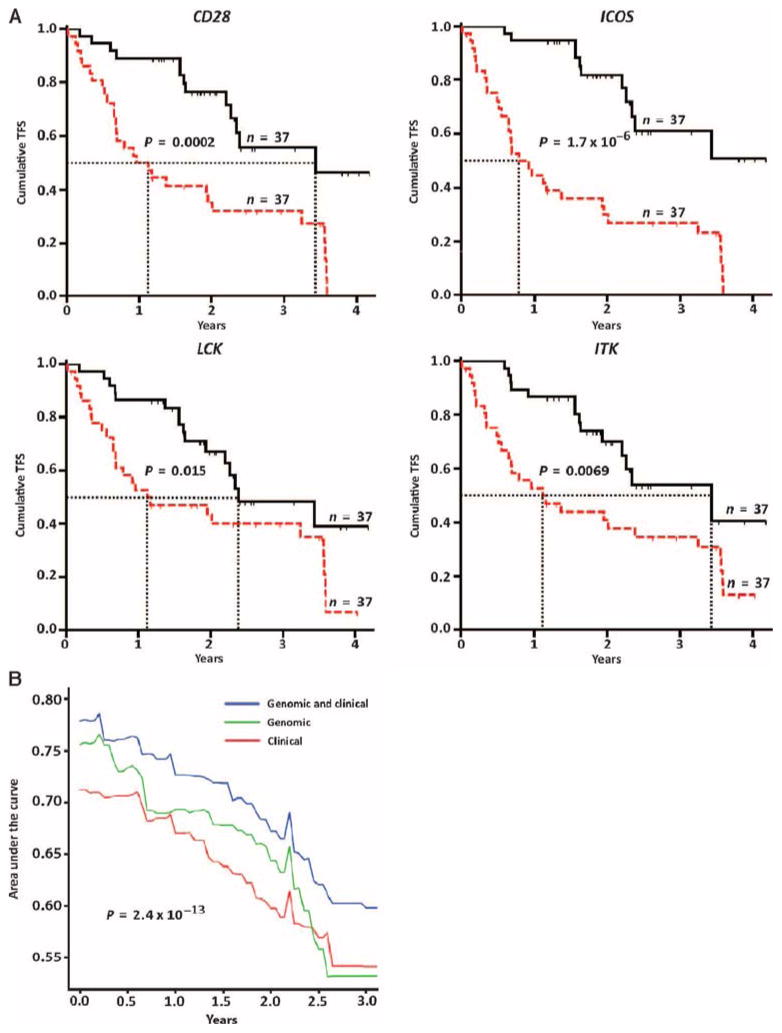
Fig. 4. CD28, ICOS, LCK, and ITK are potential IPF outcome biomarkers.
(A) TFS analysis in the replication cohort (n = 74) with available qRT-PCR data for CD28, ICOS, LCK, and ITK. In the Kaplan-Meier plots for each gene, the red lines are patients with expression levels above the ΔCt median value (representing a decrease in gene expression); the black lines are patients with expression levels below the ΔCt threshold (representing an increase in gene expression); the median survival of each group is depicted in dotted vertical lines. P values were determined by the log-rank test. (B) AUC of time-dependent ROC analysis for TFS based on clinical and/or genomic models in replication cohort subjects with all available variables (n = 72). Genomic model included continuous ΔCt values of CD28, ICOS, LCK, and ITK. Clinical model included age, gender, and FVC%. P values were determined by the Wilcoxon signed rank test.

