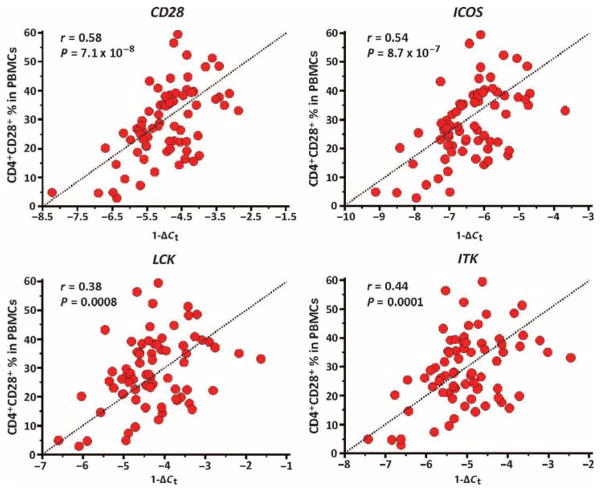
Fig. 5. Expression levels of CD28, ICOS, LCK, and ITK correlate with the number of circulating CD4+CD28+ T cells.
Correlation between the percentage of CD4+CD28+ T cells in PBMCs and their corresponding 1 − ΔCt SmartChip qRT-PCR expression levels of CD28, ICOS, LCK, and ITK in (n = 72) patients from the replication cohort. P values were determined by Student’s t distribution for Pearson correlation.

