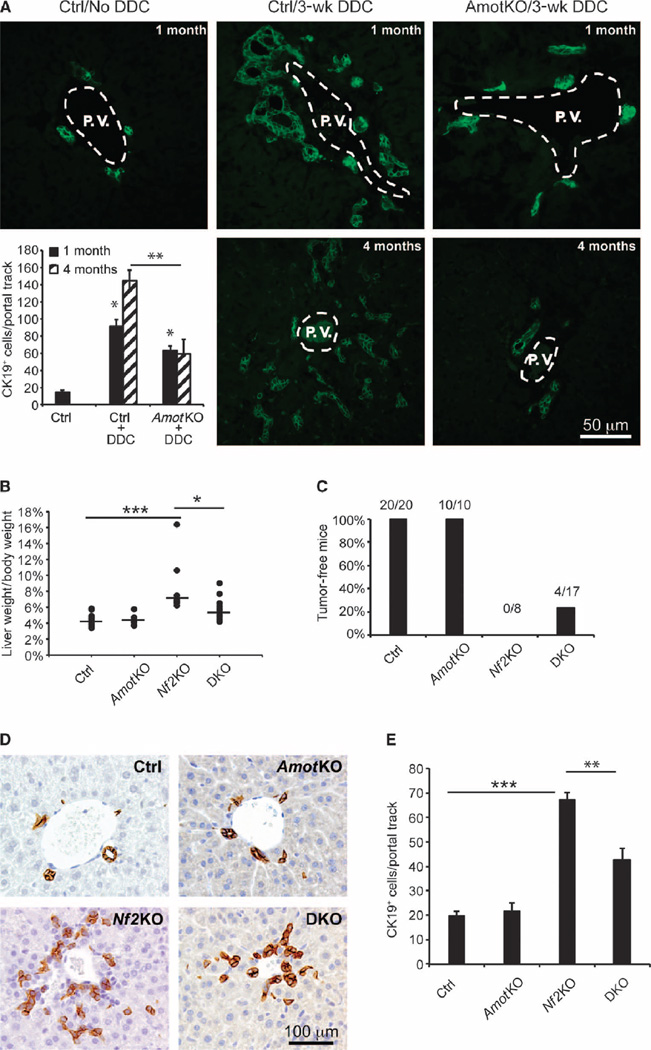
Fig. 1. Deletion of Amot attenuates oval cell proliferation and tumorigenesis induced by DDC treatment or Nf2KO in the liver.
(A) Immunofluorescence (IF) analysis of CK19 abundance in liver sections from untreated or DDC-treated wild-type (WT) (Ctrl) or AmotKO mice. Representative images of CK19-stained livers from each experimental group are shown. Oval cell response is shown as mean ± SEM of CK19+ cells per portal track (two portal tracks per animal, n = 5 mice). *P = 0.02; **P = 2 × 10⁻⁵, analysis of variance (ANOVA) with Bonferroni correction. One-month-old DDC experimental groups: Ctrl/–DDC (n = 3 mice), Ctrl/+DDC (n = 4), AmotKO/+DDC (n = 6). Four-month-old DDC experimental groups: Ctrl/+DDC (n = 5), AmotKO/+DDC (n = 5). P.V., portal vein. Scale bar, 50 µm (B) Percentage of liver weight to body weight in control (Ctrl; n = 20 mice), AmotKO (n = 10), Nf2KO (n = 8), and DKO (n = 17) mice at 7 weeks of age. *P = 0.02; ***P < 0.001, ANOVA with Bonferroni correction. (C) Percentage and ratio of tumor-free WT (Ctrl; n = 20 mice), AmotKO (n = 10), Nf2KO (n = 8), and DKO (n = 17) mice. (D) Immunohistochemistry (IHC) analysis of CK19 abundance in livers from WT (Ctrl), AmotKO, Nf2KO, and DKO mice. Representative images of CK19-stained livers from each experimental group are shown. Scale bar, 100 µm. (E) Analysis of (D). Data are means ± SEM of CK19+ cells per portal track in the nontumor regions of the livers from each genotype. WT (Ctrl; n = 5 mice), AmotKO (n = 3), Nf2KO (n = 4), and DKO (n = 5). **P = 0.024; ***P < 0.001, two-tailed t test.

