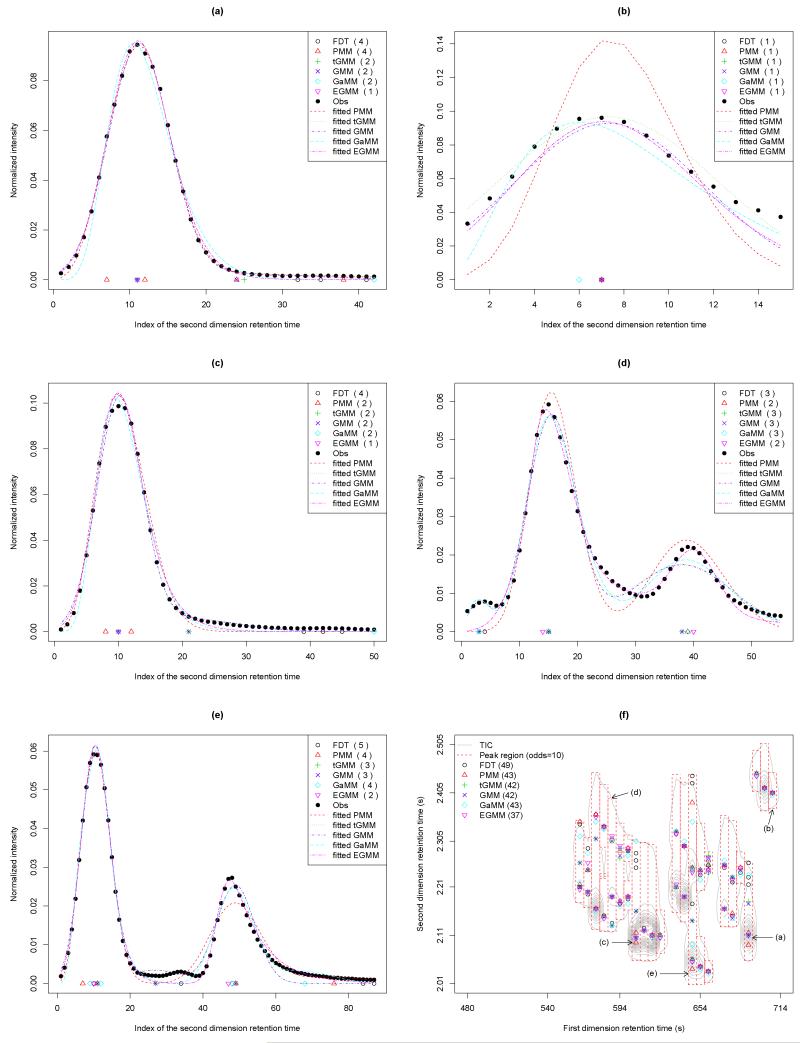
Fig 2.
The fitted peak regions and the detected peaks when the cut-off value of odds is 10. The detected peak positions are indicated by black circle (FDT), red triangle (PMM), green ‘+’ (tGMM), blue ‘×’ (GMM), sky-blue rhombus (GaMM), and purple inverted-triangle (EGMM). ‘Obs’ means the observed intensities. The detected nonzero peak regions and peaks before peak merging are in (f). The indices (a)-(e) in (f) indicate the peak region corresponding to each of the fitted plots (a)-(e).

