
Figure 1.
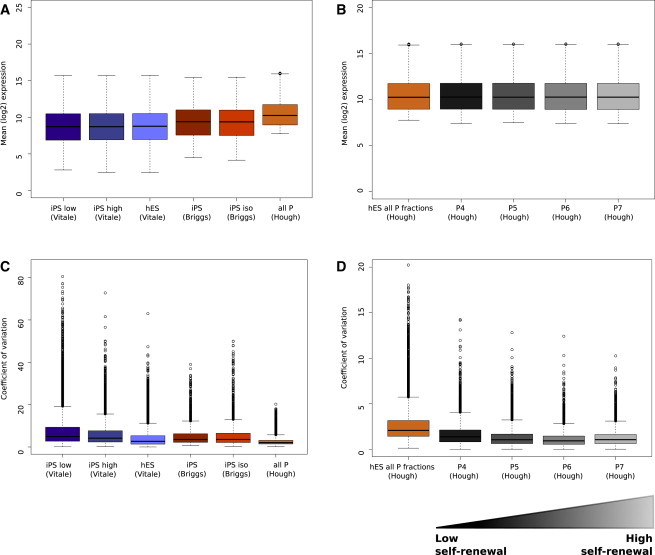
Expression Variability Is Concordant with Population Heterogeneity
(A) and (C) display the average log2 expression levels and the corresponding CoV profiles of each cell phenotype from three independent experimental series.
(B) and (D) illustrate the same metrics between subfractions of a stem cell colony with differing pluripotency phenotypes. The x axes describe the cell phenotype and the experimental series, and the y axes describe the population metric as either coefficient of variation or average log2 gene expression.