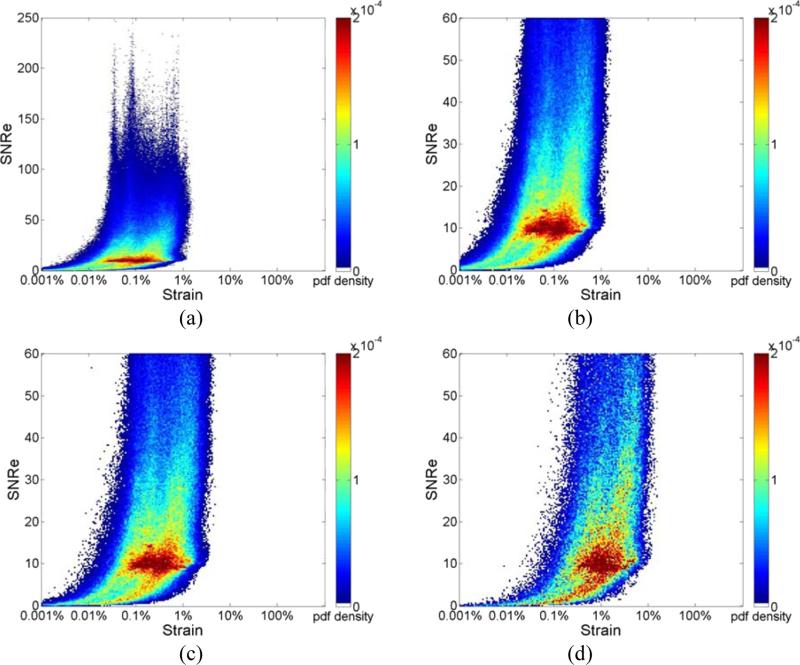
Figure 1.
Joint probability density function of the corresponding SNRe of the ideal incremental strain estimates, derived directly from the FEA model at frame rate of (a) 250Hz where the y-axis of the SNRe plot ranges from 0 to 250; (b) 250Hz;(c) 83Hz; and (d) 21Hz where the y-axis of the SNRe plot ranges from 0 to 60 for improved visualization of different strain concentrations in the probability density function mapping.

