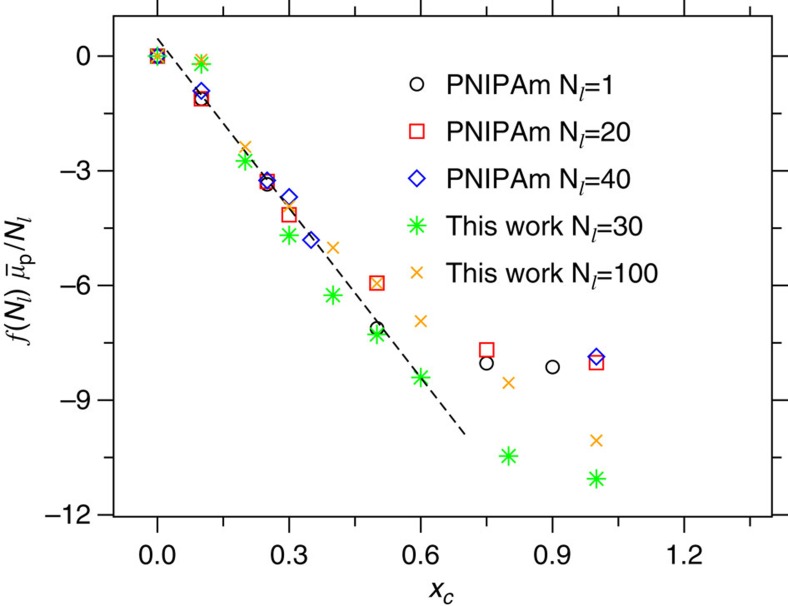
Figure 2. Thermodynamics of polymer collapse.
Chemical potential shift  per monomer as a function of cosolvent mole fraction xc.
  obtained from the generic model is compared with the data from the atomistic configuration of PNIPAm, which is taken from ref. 17. The master curve is obtained by normalizing the
  with a chain length Nl-dependent function f(Nl)=2Nl/(Nl+1) (see Supplementary Note 3).

