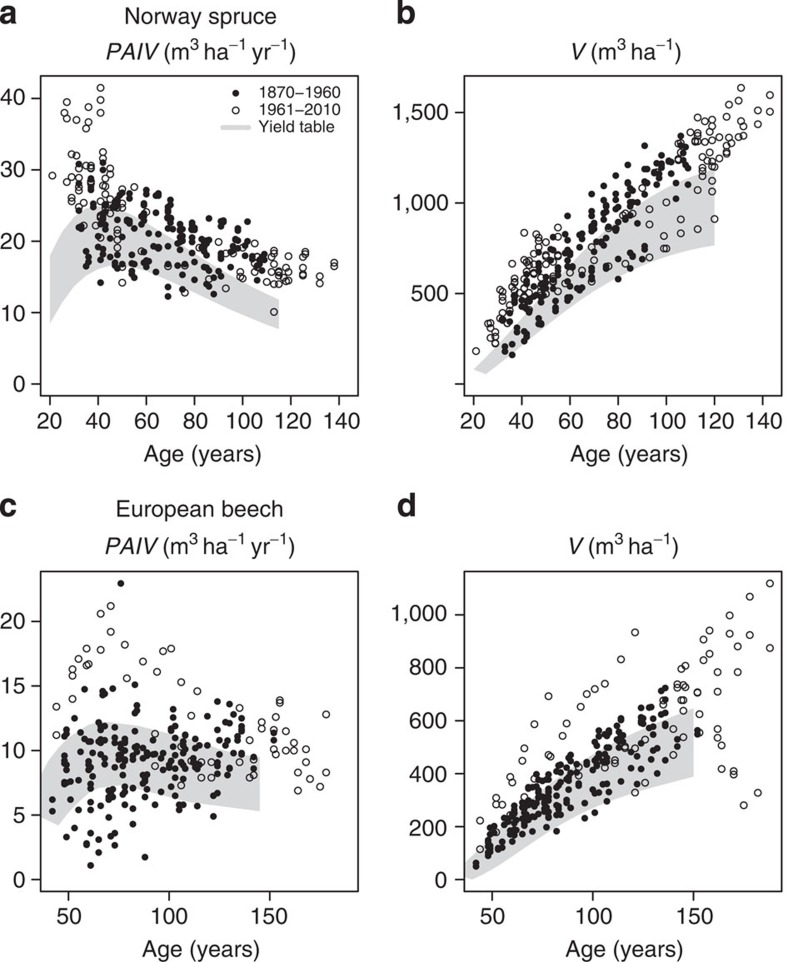
Figure 1. Observed versus expected stand growth for Norway spruce and European beech since 1870.
Observed Periodic Annual Volume Increment (PAIV in m3 ha−1 per year) for Norway spruce (a) and European beech (c), and wood standing stock volume (V in m3 ha−1) for Norway spruce (b) and European beech (d) up to 1960 (filled symbols) and after 1960 (empty symbols) compared with a common yield table for Norway spruce4 (grey section: site index 32–40) and European beech5 (grey section: site index I–IV).

